
Application Note
HTRF cAMP HiRange Assay on SpectraMax Multi-Mode Microplate Readers
- Highly robust homogeneous assay
- Z’ factor ≥ 0.9
- Streamlined and stable for HTS
- Faster time to results with SoftMax Pro Software protocols
Introduction
In this application note we show how the SpectraMax®i3, SpectraMax®Paradigm®, and SpectraMax®M5e Multi-Mode Microplate Readers are used to perform robust, high-throughput HTRF®assays with excellent Z’ factors and highly reproducible EC50values.
HTRF is a versatile technology developed by Cisbio Bioassays for detecting biomolecular interactions1. It combines fluorescence resonance energy transfer (FRET) technology with time-resolved (TR) measurement of fluorescence, allowing elimination of short-lived background fluorescence. The assay uses donor and acceptor fluorophores. When donor and acceptor are close enough to each other, excitation of the donor by an energy source (e.g., a flash lamp) triggers an energy transfer to the acceptor, which in turn emits specific fluorescence at a given wavelength.
HTRF uses four specific fluorophores that can be combined to form compatible donor-acceptor TR-FRET pairs. The donors are europium cryptate (Eu3+) and Terbium (Lumi4™-Tb) cryptate, whose long-lived fluorescence enables their use in timeresolved fluorescence assays1. Two acceptors have been developed for use in HTRF assays, XL665 and d2. Both have excitation spectra that overlap the emission spectrum of the HTRF donors. Each has an emission peak at 665 nm that falls within a region where the donor does not emit, or emits very weakly. The original HTRF acceptor, XL665, is a phycobiliprotein pigment purified from red algae. A second generation acceptor, d2, is a modified allophycocyanin that is 100 times smaller than XL665 and was developed to alleviate steric hindrance problems that may occur with XL665-based assays.
The HTRF cAMP HiRange kit enables quantitation of cyclic AMP (cAMP, cyclic adenosine 3’, 5’–monophosphate) in cellular samples. cAMP is a key second messenger in G protein-coupled receptor (GPCR) signaling. Upon ligand binding to a GPCR, a conformational change occurs, activating the receptor and in turn activating a G protein. Further signal transduction depends on the type of G protein activated. Activation of Gs leads to upregulation of cAMP by adenylate cyclase. Free cAMP produced by cells competes with d2-labeled cAMP for binding to the anti-cAMP cryptate, so an increase in cellular cAMP leads to a decrease in FRET, which is detectable as a decrease in the fluorescence emitted at 665 nm (Figure 1).

***Figure 1. cAMP assayprinciple.*Unlabeled cAMP produced by cells competes with d2-labeled cAMP for binding to anti-cAMP cryptate conjugate. Thus an increase in cellular cAMP leads to a decrease in FRET.
Materials
- cAMP HiRange 1000 tests (Cisbio P/N 62AM6PEB)
- Black and white low volume 384-well microplates (Greiner P/N 784076 and 784075)
- SpectraMax i3 Multi-Mode Microplate Reader (Molecular Devices)
- SpectraMax ParadigmMulti-Mode Microplate Reader (Molecular Devices)
- SpectraMax M5eMulti-Mode Microplate Reader (Molecular Devices)
- HTRF Detection Cartridge (Molecular Devices P/N 0200-7011)
Methods
The HTRF cAMP HiRange kit was provided by Cisbio Bioassays. cAMP standards with final concentrations ranging from 0.17 nM to 2800 nM were prepared as indicated in the cAMP HiRange HTRF package insert. A positive control without cAMP (maximum FRET) and a negative control without cAMP or cAMP-d2 were included. Reagents were dispensed in a final volume of 20 μL per well as indicated in Table 1.
Table 1. Assay setup for a 384-well low-volume plate. The plate was covered and incubated for one hour at room temperature. Time-resolved fluorescence was measured on the SpectraMax Multi-Mode Microplate Readers (see Table 2 for instrument settings). Both Microplate Optimization and Read Height Adjustment were performed on the SpectraMax i3 and SpectraMax Paradigm readers to ensure optimal assay sensitivity and dynamic range.
Data Analysis
Analysis of HTRF assays uses Cisbio’s patented ratiometric reduction method based on the two emission wavelengths detected. Donor emission at 616 nm is used as an internal reference, while acceptor emission at 665 nm is used as an indicator of the biological reaction being assayed. This ratiometric measurement reduces well-to-well variation and eliminates compound interference. Delta F, calculated in step 4 below, reflects signal to background of the assay and is useful for inter-assay comparisons.
Results are calculated from the 665 nm/616 nm ratio and expressed in Delta F as follows:
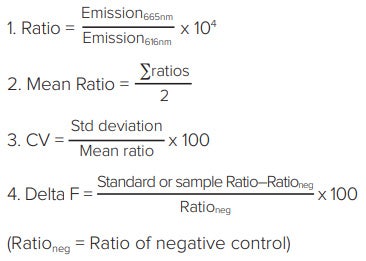
Z’ factor values were calculated using the negative (no cAMP, no cAMP-d2) and positive (no cAMP) controls2.
Data were generated and analyzed using SoftMax®Pro Software, which contains several preconfigured HTRF protocols to simplify detection and analysis.
Results
Data were analyzed as described above and graphed with SoftMax Pro Softwareusing a 4-parameter curve fit. Best results were obtained with the reader settings indicated in Table 2. When delay time, integration time, and number of pulses were increased, a noticeable decrease in DF % was observed. An increase in assay window from 3020 to 3253 was obtained using a black low-volume 384-well microplate, compared to a white microplate of the same design (Figure 2). However, Z’ factors, which take into account both assay window and standard deviation of positive and negative controls, and EC50values were very similar for both plate types (Table 3). (Note: when using a SpectraMax M5eMulti-Mode Microplate Reader, white plates are required.)
Ex 340 nm Em 616 nm
Em 665 nm
Number of Pulses: 30
Excitation Time: 0.05 ms
Measurement Delay: 0.02 ms
Integration Time: 0.2 ms
Read Height: 7.5-7.7 mm*
Ex 314 nm Em 620 nm
Em cutoff 570 nm
Em 665 nm
Em cutoff 630 nm
Integration Delay: 50 µs
Integration Time: 400 µs
*Optimal read height depends upon the microplate, assay volume, and reader optics Table 2. Optimized instrument settings for SpectraMax i3, SpectraMax Paradigm, and SpectraMax M5e readers.
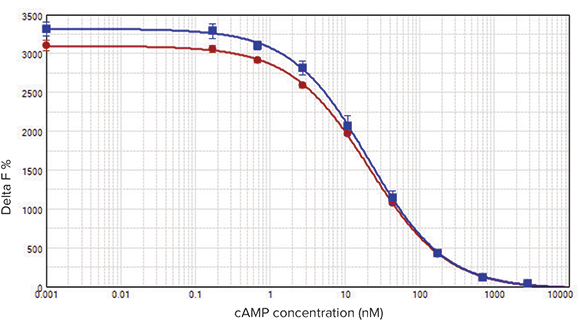
***Figure 2. Comparison of white and black microplates.*HTRF cAMP calibration curves measured on the SpectraMax Paradigm reader. Red circles: Greiner white plate; blue squares: Greiner black plate. In this example, using a black plate increased the assay window from 3020 to 3253 (units of Delta F%).
cAMP EC
50
(nM)
Table 3. Results summary for cAMPHiRange standard curve.
SpectraMax i3 and SpectraMax Paradigm readers produced nearly identical results when compared side by side with the same assay plate (Figure 3). For this test, a white microplate was used. Assay windows were 3004 and 3051, and Z’ factors were 0.92 and 0.90, respectively. EC50values were 19.1 nM and 20.0 nM, comparable to published values (Table 3.) Similar Z’ factors and EC50values are obtained with the SpectraMax M5eMulti-Mode Microplate Reader.
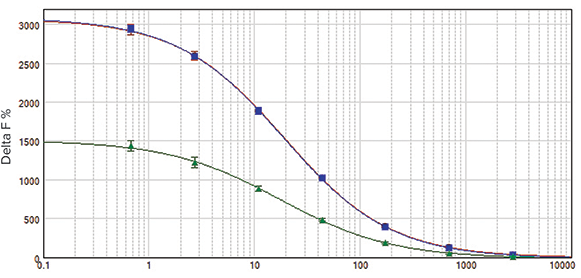
***Figure 3. HTRF cAMP calibration curve.*HTRF cAMP calibration curve measured on the SpectraMax i3 (red circles), SpectraMax Paradigm (blue squares), and SpectraMax M5e (green triangles) readers. Results on SpectraMax i3 and SpectraMax Paradigm readers were virtually identical. The assay window for the SpectraMax M5e reader was smaller but the assay quality was excellent.
Read time on the SpectraMax Paradigm reader is faster than on the other readers due to its dual PMT configuration that enables both HTRF emission wavelengths to be read simultaneously (Table 3).
Conclusion
The SpectraMax i3 and SpectraMax Paradigm readers can be equipped with an HTRF-certified detection cartridge with high-throughput screening capabilities. When used on the SpectraMax Paradigm reader, this cartridge offers simultaneous dual emission detection that enables faster read times. On all three readers, excellent Z’ factor values for the cAMP HiRange assay demonstrate the robust assay performance of these multi-mode systems. Data acquisition and analysis are simplified using SoftMax Pro Software with preconfigured HTRF protocols.
References
- http://www.htrf.com/htrf-technology
- Zhang, J. H., Chung, T. D. Y., and Oldenburg, K. R. (1999). A simple statistical parameter for use in evaluation and validation of high throughput screening assays. J. Biomolecular Screening 4(2): 67-73.
Compatible with these Molecular Devices systems
简介
在这篇应用文献中,我们展示了如何用 SpectraMax® i3、SpectraMax® Paradigm® 和SpectraMax® M5e多功能微孔板读板机 进行可靠的、高通量的HTRF®检测,并具 有完美的Z’因子和高重复性的EC50值。
HTRF®是Cisbio Bioassays公司开发的一 项检测生物分子相互作用的多用途技术 1。这项技术结合了荧光共振能量转移 (FRET)技术和时间分辨(TR)荧光测定,可 消除短寿命的背景荧光。这一检测使用供 体和受体荧光基团。当供体和受体彼此足 够接近时,能量源(如氙闪灯)激发供体使 能量转移到受体上,受体发射出特定波长 的荧光。
HTRF使用4种专门的荧光基团,能够组合 成一对供体-受体TR-FRET基团。供体为铕 (Eu3+)的穴状化合物和铽(Lumi4™-Tb)的 穴状化合物,其长寿命荧光可以用于时间 分辨荧光检测中1。两种受体分别为XL665 和d2,用于HTRF检测中。这两种受体的 激发光谱均与HTRF供体的发射光谱重 叠。每个受体的发射峰都在665nm且供体 在这一范围内没有发射光或发射光很弱。 最初的HTRF受体XL665,是一种从红藻中 纯化出的藻胆蛋白色素。第二代受体d2是 一种经过修饰的别藻蓝蛋白,比XL665小 100倍且可以减少可能在XL665检测中出 现的空间位阻问题。
HTRF cAMP HiRange试剂盒能够在细胞样 品中对环腺苷酸(cAMP,环腺苷3’,5’一 磷酸)进行定量。cAMP在G蛋白偶联受体 (GPCR)信号转导中是一种关键的第二信 使。当配体结合到GPCR,构想改变就会 发生,激活受体接着激活G蛋白。进一步 的信号转导取决于激活的G蛋白类型。Gs 的激活导致腺苷酸环化酶调控cAMP的上 调。细胞中产生的自由cAMP与d2-标记的 cAMP竞争性结合抗cAMP穴状化合物抗 体,因此,细胞内cAMP的增加会导致 FRET降低,侦测到的665nm荧光发射也 会下降(图 1)。
图 1 cAMP 检测原理。细胞中产生的非标记cAMP与d2标记的cAMP竞争结合抗cAMP穴状化合 物偶联。因此,细胞中cAMP的增加导致了FRET的降低。
材料
- cAMP HiRange 1000 测试 (Cisbio P/N 62AM6PEB)
- 黑色和白色低体积384-孔微孔板 (Greiner P/N 784076 和 784075)
- SpectraMax i3 多功能微孔板读板机 (Molecular Devices)
- SpectraMax Paradigm 多功能微孔板 读板机(Molecular Devices)
- SpectraMax M5e 多功能微孔板读板机 (Molecular Devices)
- SpectraMax M5e 多功能微孔板读板机 (Molecular Devices)
方法
HTRF cAMP HiRange试剂盒由Cisbio Bioassays公司提供。按照cAMP HiRange HTRF药品说明书准备终浓度范围从0.17 nM到2800 nM的cAMP标准品。不含cAMP 的阳性质控(最大FRET)和不含cAMP或 cAMP-d2的阴性质控包含在内。按照表1 中所述,每孔添加20 µL试剂。
***表 1。384-孔低体积孔板测定的建立。*孔板在室温下孵育一小时。时间分辨荧光在SpectraMax多功 能微孔板读板机上检测(请见表2仪器设置)。微孔板优化和读数高度校准均在SpectraMax i3和 SpectraMax Paradigm读板机上进行以确保最优的测定灵敏度和动态范围。
数据分析
使用Cisbio专利的基于双发射波长检测的 比值算法分析HTRF检测。616nm发射波 长的供体作为内参,同时665nm发射波长 的受体作为测定生物学反应的指示。这种 比例测定减少了孔与孔之间的差异并降低 了化合物干扰。在第4步计算的Delta F反 映了测定时的信号相对于背景大小,用于 内部测定的比较。
结果通过665 nm/616 nm比值计算,以如 下Delta F表示:
Z’因子由阴性(无cAMP,无cAMP-d2)和阳 性质控(无cAMP)计算得到2。
利用SoftMax® Pro软件生成和分析数据, 包含一些预设的HTRF实验模板以简化检 测和分析。
结果
使用SoftMax Pro软件的4-参数曲线拟合 如上所述进行数据分析和做图。依据表2 的读板机参数设置获得最佳结果。当延迟 时间、整合时间和脉冲数增加,会观察到 DF%的下降。与白色微孔板(图2)相比, 使用黑色低体积384-孔微孔板可使检测窗 从3020增加到3253。然而,Z’因子,考 虑到阳性和阴性质控的检测窗和标准差以 及EC50值在两个孔板类型中非常相似(表 3)。(注意:当使用SpectraMax M5e多功 能微孔板读板机,需要白色孔板。)
Ex 340 nm Em 616 nm
Em 665 nm
Number of Pulses: 30
Excitation Time: 0.05 ms
Measurement Delay: 0.02 ms
Integration Time: 0.2 ms
Read Height: 7.5-7.7 mm*
Ex 314 nm Em 620 nm
Em cutoff 570 nm
Em 665 nm
Em cutoff 630 nm
Integration Delay: 50 µs
Integration Time: 400 µs
* 最优读数高度取决于微孔板、测定体积和读板机光学参数 表 2。SpectraMax i3、SpectraMax Paradigm和SpectraMax M5e读板机的优化仪器设置。
***图 2。 白色和黑色微孔板比较。*在SpectraMax Paradigm读板机上测定的HTRF cAMP标准曲线。红 色圆形:Greiner白色孔板;篮色方形:Greiner黑色孔板。在这一实例中,使用黑色孔板可以增加 检测窗从3020 到 3253(单位Delta F%)。
cAMP EC
50
(nM)
表 3 cAMP HiRange标准曲线结果总结。
SpectraMax i3和SpectraMax Paradigm 读板机在逐一比较相同测试孔板时得到的 结果基本一致(图3)。针对这一测试,利用 了白色微孔板。检测窗为3004和3051,且 Z’因子分别是0.92和0.90。EC50值是19.1 nM,相比于发布值(表3)。SpectraMax M5e多功能微孔板读板机得到相似的Z’ 因子和EC50值。
图 3 HTRF cAMP 标准曲线 SpectraMax i3(红色圆形)、SpectraMax Paradigm(蓝色方形)和 SpectraMax M5e(绿色三角)读板机上HTRF cAMP校准曲线测定。SpectraMax i3和SpectraMax Paradigm读板机结果完全一致。SpectraMax M5e读板机的检测窗稍小但检测质量很高。
RSpectraMax Paradigm读板机得益于双PMT 配置而比其他读板机更快,使之可以同时 读取两个HTRF发射波长(表3)。
总结
SpectraMax i3和SpectraMax Paradigm 读板机可配置具有高通量筛选能力且 HTRF认证的检测卡盒。当在SpectraMax Paradigm读板机上使用时,此卡盒能进 行双发射同时检测从而加快读数速度。在 三个读板机中,cAMP HiRange测定得到的完美Z’因子表明了多 功能检测系统的可靠性能。采用SoftMax Pro软件自带的HTRF预设实验模板大大简 化了数据采集和分析。
参考
- http://www.htrf.com/htrf-technology
- Zhang, J. H., Chung, T. D. Y., and Oldenburg, K. R. (1999). A simple statistical parameter for use in evaluation and validation of high throughput screening assays. J. Biomolecular Screening 4(2): 67-73.
与以下Molecular Devices 系统兼容