
Application Note
Fluorescence-based quantitation of small DNA samples with the SpectraDrop Micro-Volume Microplate
- DNA detection down to 2.5 pg/µL
- Unmatched throughput
- Calibration-free setup
- Easy-to-clean design
Introduction
Measurement of DNA using UV absorbance is a common method allowing quantitation of many sample types. However, some applications require quantitation of very low sample volumes or concentrations due to preparation method or scarcity of source material. For these applications, fluorescent DNA quantitation methods offer greater sensitivity and the ability to use smaller sample volumes with lower concentrations.
Molecular Devices’ SpectraDropTM MicroVolume Microplate for SpectraMax® microplate readers offers higher throughput than any other low-volume microplate, with up to 64 samples per plate. Samples with volumes as low as 2 µL can be measured. The SpectraDrop microplate incorporates a specially designed adapter and a slide pair whose optical clarity allows measurements in absorbance and fluorescence modes to meet users’ application needs (Figure 1).
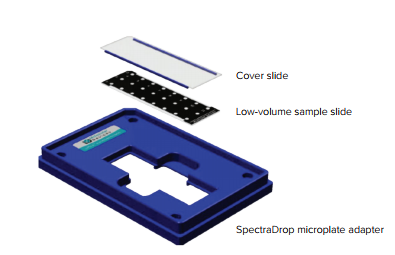
Figure 1. SpectraDrop Microplate configuration. The low-volume sample slide has a mask delineating spots or ‘wells’ that hold 24 or 64 samples. The cover slide has 0.5 mm or 1.0 mm spacers for use with 2 µL or 4 µL samples, respectively.
Here, we show that the QuantiFluor dsDNA assay from Promega can be adapted to a low-volume microplate format that enables users to measure samples as small as 2 µL, with a sensitivity of 5 pg per sample, or 2.5 pg/µL. This is about 1000 times more sensitive than low-volume absorbance quantitation of DNA, where sensitivity is limited to about 2000 pg/µL, making it ideal for applications, e.g. next-generation sequencing, that require sensitivity beyond that offered by absorbance methods.
Low-volume assay procedure
The assay procedure was modified slightly for low-volume setup as follows. Standards ranging from 1 pg/µL to 1000 pg/µL were prepared in TE buffer. 2 µL of each standard was pipetted onto the wells of the SpectraDrop bottom slide in triplicate using an 8-channel pipettor. 2 µL of QuantiFluor dsDNA Dye working solution was then pipetted onto the samples with mixing, for a total sample volume of 4 µL per well. Blank replicates containing buffer and dye were included to determine background fluorescence levels. The cover slide was then positioned over the samples, and the assembly was incubated for 5 minutes in the dark prior to reading the plate.
Plate reader setup
The SpectraDrop microplate was read on the SpectraMax® Paradigm® Multi-Mode Microplate Reader using the Fluorescence Intensity detection cartridge (FI-FLRH) with fluorescein filters, or Tunable Wavelength Selection (TUNE) cartridge with signal/ background-optimized wavelengths. It was also read on the monochromator-based SpectraMax® M5e Multi-Mode Microplate Reader using optimized wavelengths. Settings are for each instrument are shown in Table 1.
SpectraMax Paradigm
reader (FI-FLRH)
SpectraMax Paradigm
reader (TUNE)
SpectraMax M5e
reader
Ex wavelength
(nm/bandwidth)
Em wavelength
(nm/bandwidth)
Integration time
140 ms
Integration time
140 ms
Auto PMT
10 flashes/read
Table 1: Instrument settings for QuantiFluor assay.
SoftMax® Pro Software was used to acquire and analyze all data. A preconfigured QuantiFluor protocol for the SpectraDrop microplate simplified data collection and analysis. A specific SpectraDrop microplate definition is also available in the software to simplify new protocol setup and ensure data accuracy. Additionally, the SpectraMax Paradigm reader enables microplate optimization of the SpectraDrop microplate, using scans of the four corner samples to fine-tune the plate definition for more accurate results. Read height optimization was performed on the SpectraMax Paradigm reader to maximize signal detection.
Assay linearity and sensitivity
The QuantiFluor assay detected in the SpectraDrop microplate was linear across the range of standards tested (1-1000 pg/µL), with a standard curve r2 value of 0.999 (Figure 2). The lower limit of detection (LLD) calculated using three times standard deviation of the background was 5 pg/well, or 2.5 pg/µL.
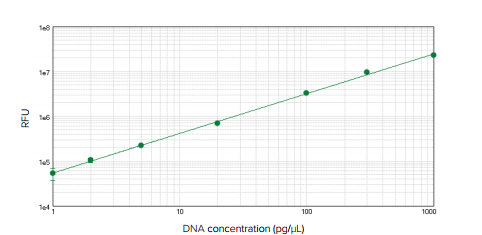
Figure 2. dsDNA standard curve. dsDNA dsDNA standard curve using SpectraDrop Micro-Volume Microplate on the SpectraMax Paradigm reader. The lower limit of detection for dsDNA was 5 pg/well, or 2.5 pg/µL. Standard curve r2 = 0.999. Similar results were obtained with the SpectraMax M5e reader.
Summary
Researchers working with small DNA samples often need a way to quantitate them in a small-volume, highly sensitive format. The SpectraDrop Micro-Volume Microplate enables measurement of DNA samples as low as 2.5 pg/µL, which is 1000 times more sensitive than lowvolume absorbance methods. Using the QuantiFluor dsDNA assay with the SpectraDrop microplate allows users to minimize sample loss without sacrificing accuracy of results.
The SpectraDrop microplate slides are easy to handle, and all optical surfaces are fully accessible for ease of cleaning. No well-to-well calibration is required, as the spacer and slide design provide excellent well-to-well uniformity. 24- and 64-well sample slides, as well as cover slides with 0.5- or 1.0-mm spacers, are available to meet users’ throughput and sample volume needs. The SpectraDrop microplate is compatible with all SpectraMax readers including the SpectraMax Paradigm reader, as well as the StakMax® Microplate Handling System.