
Application Note
Monitoring receptor mediated changes in [Ca2+] i using single- and dual-wavelength indicators on the FlexStation 3 reader
- Versatile reader for kinetic, cell-based fluorometric assays such as the measurement of intracellular calcium, membrane potential, and intracellular pH
- Reliable, reproducible data for calcium mobilization assays used to monitor Gq-coupled GPCRs
- Ratiometric properties of the dye result in a five-fold increase in signal
Introduction
The FlexStation® 3 Multi-Mode Microplate Reader integrates sensitive optics, fluid transfer and temperature control making it ideal for kinetic, cell-based fluorometric assays, such as the measurement of intracellular calcium, membrane potential and intracellular pH.
Calcium (Ca2+) is the most common signal transduction element in cells ranging from bacteria to specialized neurons. Measurement of changes in the concentration of intracellular cations, for example Ca2+, is important in understanding the mechanisms of many cellular processes.1 A range of events such as receptor-ligand interactions mediate the elevation of intracellular calcium ([Ca2+] i ) levels from \~100 nM to \~1 µM, this can trigger a number of events including the release of synaptic transmitters, muscle contraction, hormone secretion, cell movements or apoptosis.
Changes in [Ca2+] i ) can be measured either with single-wavelength dyes (e.g. Fluo-3 and the FLIPR® Calcium Assay Kit) or dualwavelength ratiometric indicators such as Fura-2. With single-wavelength dyes the fluorescence intensity is dependent on the Ca2+ concentration whilst ratiometric indicators undergo a spectral shift that is proportional to the Ca2+ concentration (Figure 1). The most common singlewavelength indicators such as Fluo-3 are excited with visible light and the most common dual-wavelength dyes (Fura-2) require UV light.2
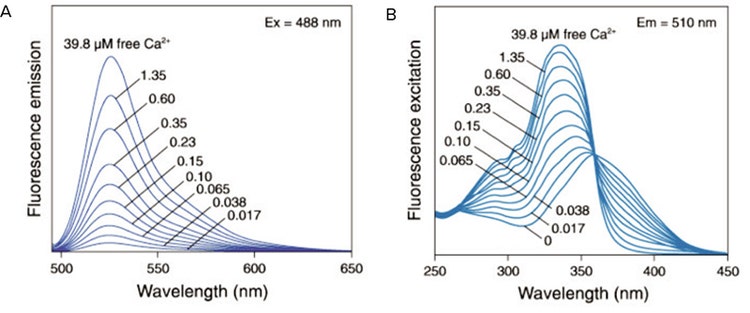
Figure 1. Fluo-3 emission spectra. The fluorescence emission spectra of Fluo-3 (A) and fluorescence excitation spectra of fura-2 (B) in solutions containing zero to 39.8 µM free Ca2+.*** Reprinted from Molecular Probes Handbook of Fluorescent Probes and Research Chemicals.*
The FlexStation 3 reader incorporates a tunable Xenon-lamp based light source and dual scanning monochromators that permit the use of dual-wavelength dyes for functional cellular assays. Although visible, light-excitable Ca2+ indicators offer benefits such as reduced interference from sample auto fluorescence and higher absorbance by the dye (permitting the use of lower dye concentrations), ratiometric dyes offer several advantages over conventional single-wavelength indicators. Benefits of using the 340/380 nm excitation ratios for Fura-2:
- Signal is not dependent on dye concentration, illumination intensity, or optical path length
- The effects of uneven dye loading, dye leakage and photo bleaching are minimized; detection can usually be made over a period of 1 hour without significant loss of fluorescence
- A more stable signal and better signal-tonoise ratio may be obtained for increased sensitivity
- Accurate measurements of the intracellular Ca 2+ concentration is possible
An alternative approach is a series of ‘no-wash’ reagents available from Molecular Devices, such as the FLIPR Calcium Assay Kit. These too confer a number of potential advantages over conventional Ca2+ indicators. ‘No-wash’ reagents may reduce these problems in a conventional assay protocol:
- Cells removed from the plates during the washing procedure
- Reduced responsiveness (competence) of the cells following washing
- Variation in the residual volume of wash buffer, leading to variation in the concentration of test compound
- The drop in fluorescence (resulting from the dilution of residual extracellular dye) upon addition of the test compound.
In this application note we demonstrate the use of both single-wavelength and dual-wavelength Ca2+ indicators in the FlexStation 3 reader and the possible benefits of a homogeneous assay system.
Background
Platelet preparation
CHO-K1 cells contain endogenous nucleotide receptors (P2Y2)3,4 that are linked to activation of phospholipase C, generation of inositol phosphates (IPs), activation of protein kinase C (PKC) and release of intracellular Ca2+ stores.5 Purinoceptors are expressed in the vast majority of cells and tissues, where they control a wide range of physiological processes and are subdivided into two families, P2X and P2Y receptors. P2X receptors are ATP-gated ion channels, whereas P2Y receptors belong to the superfamily of GPCRs. The P2Y family of receptors includes the P2Y1 , P2Y2, P2Y4 , P2Y6, P2Y11, P2Y12, P2Y13 and P2Y14 receptor.6 The P2Y subtypes differ pharmacologically in their selectivity for adenine and uracil nucleotides and the principal physiological ligands for the P2Y2- receptor are UTP and ATP.7 One important functional role of the P2Y2-receptor is the control of chloride ion fluxes in airway epithelia and mucociliary clearance in the lung, and thus may play a role in cystic fibrosis and other airway disorders.
Novel ligands targeting P2Y-receptors represent potential therapeutic agents and the ability to screen such compounds reliably and reproducibly has been demonstrated using the FlexStation 3 reader.
Using Z’ factor analysis8 and comparison of EC50 estimates and signal magnitude, we show the benefits of ratiometric Ca2+ dyes and homogeneous assay formats over more traditional Ca2+ indicators.
Materials
- Cells: CHO cells - adherent Chinese Hamster Ovary cells (ECACC, Cat. #85051005)
- Reagents: FLIPR Calcium Assay Kit (Molecular Devices, Cat. #R8041), ATP (Adenosine 5’-triphosphate disodium salt, Sigma, Cat. #A2383), probenecid (Sigma, Cat. #P8761), DMSO, low water content (Sigma, Cat. #D2650), Fluo-3 AM ester (Molecular Probes, Cat. #F1242), Fura-2 AM ester (Molecular Probes, Cat. #F1221) and 20% pluronic acid solution (Molecular Probes, Cat. #P3000)
- Plasticware: 75 cm 2 culture flasks (Corning Cat. #430641), 96-well black walled, clear bottomed plates (Costar, Cat. #3603), 96-well clear, U-bottom polypropylene plates (Greiner Bio-One, Cat. #650101), Pipette tips for FlexStation - 200 µL non-sterile, polypropylene tips (Molecular Devices, black Cat. #9000- 0911 or clear Cat. #9000-0912)
- Media and buffers: Hams-F12 medium (Invitrogen Life Technologies, Cat. #31765-027), Hank’s Balanced Salt Solution (10X) (Invitrogen Life Technologies, Cat. #14065-049), HEPES 1M buffer solution (Invitrogen Life Technologies, Cat. #15630-056), FBS: (Fetal Bovine Serum, heat inactivated, Invitrogen Life Technologies, Cat. #10099-141), Geneticin (G418, Invitrogen Life Technologies, Cat. #10131-019).
Methods
Fluo-3 and Fura-2 reagent preparation
Wash buffer: this buffer contains a final concentration of 1X HBSS and 20 mM HEPES diluted in sterile d.H2O. Important: To prevent dye extrusion by the anion exchange protein, the loading medium was supplemented with 2.5 mM probenecid.
Prepare a fresh stock of 250 mM probenecid. Dissolve 710 mg probenecid in 5 mL of 1 M NaOH then add 5 mL of wash buffer and agitate vigorously.
Fluo-3 and Fura-2 stock solution. Add 25 µL DMSO to 50 µg Fluo-3 AM or Fura-2 AM (final concentration \~2 mM).
Dye loading buffer: Mix 25 µL Fluo-3 or Fura-2 and 25 µL 20% pluronic acid solution, add this to 12 mL wash buffer containing 2.5 mM probenecid then add 120 µL FBS. This prepares enough reagent for approximately one 96-well plate. Pluronic acid is used to enhance dye solubility and uptake.
FLIPR Calcium Assay Kit preparation
Prepare 1X Reagent Buffer using component B and Loading Buffer by diluting component A with 1X Reagent Buffer as described in the instructions provided with the kit.
Prepare a fresh stock of 250 mM Probenecid as above.
Add 1:50 dilution of 250 mM probenecid to the Loading Buffer (final concentration 5 mM) and 1:100 dilution of 250 mM probenecid to 1X Reagent Buffer (final concentration 2.5 mM).
Cell preparation
CHO cells (passage number < 40) were cultivated in 75cm2 flasks as a monolayer in Hams-F12 medium supplemented with 10% foetal bovine serum and 5 µg/mL G418, and maintained at 37°C in a CO2 incubator. Cells were passaged 1:10 every 2-3 days.
Measurement of [Ca2+] i
CHO cells were seeded into black walled, clear-base 96-well plates (Costar) at a density of \~30,000 cells per well in Hams-F12 medium, supplemented as above and cultured overnight. The cells were then incubated with the appropriate calcium indicator; Fluo-3, Fura-2 or FLIPR Calcium Assay Kit; and 2.5 mM probenecid at 37ºC for 60 minutes (see appendix).
The cells loaded with Fluo-3 or Fura-2 were washed manually (BioHit 8-channel pipette) three times with Hanks BSS medium containing 2.5 mM probenecid, cells loaded with the FLIPR Calcium Assay Kit did not require this wash step (see Figure 2.). The final volume in each well was 200 µL.
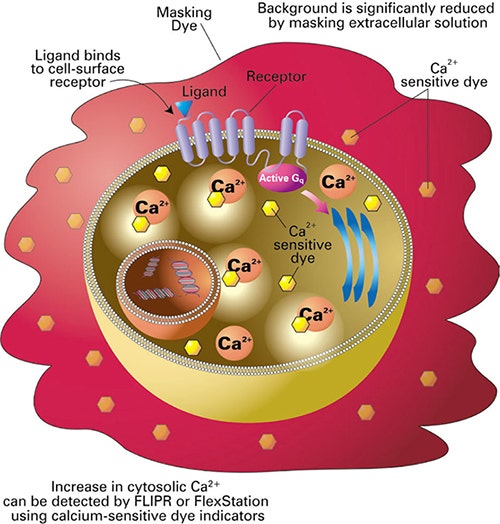
Figure 2. Principle of the FLIPR calcium assay. The FLIPR Calcium Assay Kits include a calciumsensitive dye that is taken into the cytoplasm of the cell during the incubation period. The cellimpermeant masking dye remains outside the cell and blocks background fluorescence. Upon ligand binding to the receptor, calcium is released into the cytoplasm of the cell. The dye binds to the intracellular calcium and an increase in fluorescence is measured.
The cell plates were then placed into the FlexStation 3 reader to monitor fluorescence before and after the addition of ATP (50 µL addition, ATP made at 5X final concentration, final concentrations 30 nm– 30 µM). Experimental parameters are shown following:
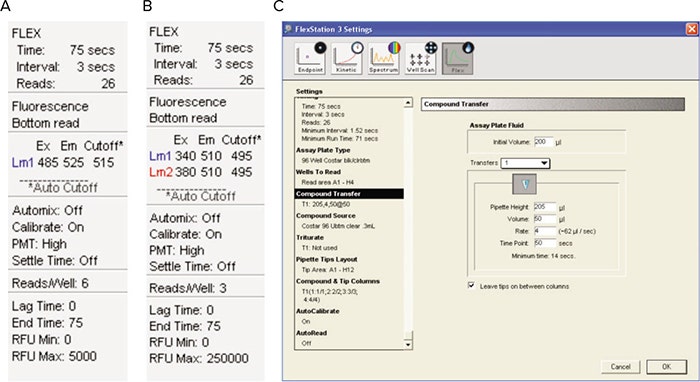
Figure 3. SoftMax® Pro Software settings. Experimental parameters for (A) Single-Wavelength dyes only, (B) Fura-2 only and (C) All three dyes.
Data Analysis
Responses were measured as peak fluorescence intensity minus basal fluorescence intensity (Fluo-3 or FLIPR Calcium Assay Kit) or the 340/380 nm excitation ratios, calculated within SoftMax Pro, for Fura-2. Data are expressed as mean ± s.e. mean with n > 12.
Individual sets of E/[A] curve data were fitted to a four-parameter logistic of the form:

where a, b, EC50 and n are the asymptote, bottom of curve, location (expressed as -log10 EC50 ) and slope parameters respectively. All curvefitting routines were carried out using GraphPad Prism 3.0 (GraphPad Software Inc.).
Z´ factors were calculated using the formula:

where σc+ denotes standard deviation of the positive control and σc- represents standard deviation of the negative control. The term |µc+ – µc-| denotes the absolute value of the difference between the mean of the positive control and the mean of the negative control. A Z´ factor > 0.5 indicates a large separation band between the negative and positive controls and an excellent assay.
Results
ATP elicited a concentration-dependent increase in [Ca2+] i in CHO cells (Figure 4.) with similar EC50 values for cells loaded with Fluo-3, Fura-2 and FLIPR Calcium Assay Kit respectively (Table 1).
One-way Analysis of Variance (ANOVA) indicated that the EC50 estimates were not significantly different from one another (P value = 0.62).
EC
50
Table 1. Comparison of three parameters calculated from ATP E/[A] curves in CHO cells: EC50, fold increase in fluorescence signal, and Z’ factor, loaded with various Ca2+ indicators.
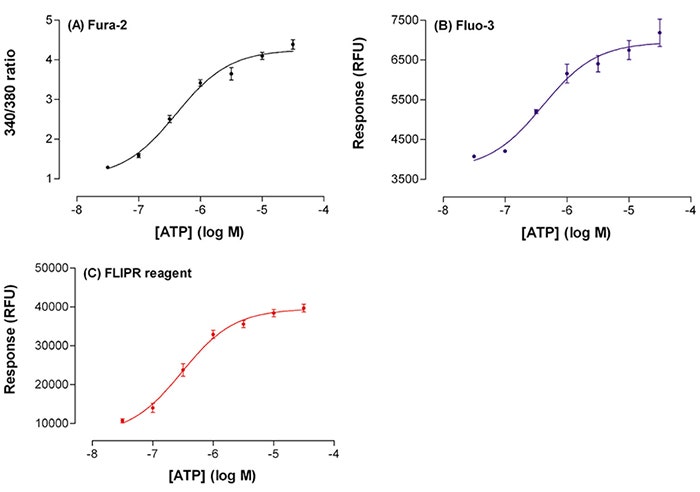
Figure 4. ATP increase with fluorescent signal. Plot of ATP concentration (x-axis) against the increase in fluorescent signal (y-axis) for cells loaded with Fluo-3 (B) and FLIPR Calcium Assay Kit (C), or the 340/380 nm excitation ratio (A) for Fura-2. The Fura-2 ratios were calculated from timeinterpolated data within SoftMax Pro Software. Data is mean ± s.e. mean.
These results indicate that there is negligible difference in the ATP EC50 values from cells loaded with the three fluorescent reagents. However, there was a significant difference between the peak fluorescent intensities of the two singlewavelength indicators. With Fluo-3 there was an increase in signal of \~3,200 RFU above basal (1.8 fold increase) whilst with the FLIPR Calcium Assay Kit the increase in signal was 32,000 RFU (5.6 fold increase, see Table 1). Peak response tended to be more variable with Fluo-3 (see Figure 4). With Fura-2 there was a 4.8 fold increase in signal above basal.
The screening coefficient window (Z’ factor), which reflects the dynamic range of the signal and the data variation for the assay8 was calculated using the buffer addition (negative control) and the 30 µM ATP addition data (positive control). Z´ factor obtained with Fura-2 and the FLIPR Calcium Assay Kit were 0.60 and 0.68 respectively (Table 1). This shows a large separation band between the negative and positive controls and a reproducible, high quality assays. The Z’ factor obtained for the Fluo-3 data was 0.28 representing a ‘useable’ assay, this probably reflects the less than optimal assay protocol and subsequent small dynamic range of the assay.
Conclusion
In this study ATP caused a concentrationdependent increase in [Ca2+] i in CHO cells endogenously expressing the P2Y2-receptor, with a potency similar to that reported previously. Furthermore, we have demonstrated that the FlexStation 3 reader can be used to generate reliable, reproducible data for calcium mobilization assays used to monitor such Gq -coupled GPCRs.
The EC50 estimates for ATP were similar whether the fluorescent dye Fluo- 3 (6.39) or Fura-2 (6.44) or the FLIPR Calcium Assay Kit (6.51) was used, and were consistent between assay plates on the same day as well as between assays analysed on different days (less than 0.6 log unit differences). However, there were significant differences in the dynamic ranges from the three different loading protocols, which is reflected in the corresponding Z’ factors. Less than a two-fold increase in signal above basal was observed when the cells were loaded with Fluo-3, the most likely cause is the subsequent wash steps in the protocol reducing cell responsiveness. Using cells of a lower passage number and a dedicated cell-washer (AquaMax® Washer or similar) would probably have improved the Z’ factor for Fluo-3 loaded cells. Under these experimental conditions, a five-fold increase in signal was observed with Fura-2 despite the cells undergoing a number of wash steps. This could be attributed to the beneficial ratiometric properties of the dye. The biggest fold increase in signal, and thus Z’ factor, was observed with the FLIPR Calcium Assay Kit indicating that this ‘no-wash’ homogeneous assay can lead to stronger signals, higher assay precision and improved physiological data.
The FlexStation 3 reader provides an easyto-use, versatile tool for pharmacological and drug screening laboratories and has proven to be suitable for kinetic, cellbased fluorometric assays such as the measurement of intracellular calcium, membrane potential, and intracellular pH.
Although the Molecular Devices homogeneous assay kits have been proven to achieve the same goal and with fewer steps in the assay, the FlexStation 3 reader benefits from the ability to use ratiometric dyes to help improve data fidelity.
References
- Berridge, M.J. (1997). Elementary and global aspects of calcium signalling. J. Physiol., 499, 291 - 306.
- Haughland, R.P. (2000). Molecular Probes Handbook of Fluorescent Probes and Research Chemicals. Chapter 20 – Indicators for Ca 2+ , Mg 2+ , Zn 2+ and Other Metal Ions.
- Endogenous GPCR List by Agi Schonbrunn, Ph.D. Department of Integrative Biology, Pharmacology and Physiology, University of Texas Health Science Center, Houston, Texas. (https://www.tumor-gene.org/GPCR/gpcr.html)
- Strassheim, D. and Williams, C.L. (2000). P2Y2 Purinergic and M3 Muscarinic Acetylcholine Receptors Activate Different Phospholipase C- Isoforms That Are Uniquely Susceptible to Protein Kinase C-dependent Phosphorylation and Inactivation. J. Biol. Chem., 275, 39767- 39772.
- Conant, A.R. et al (1998). Characterization of the P2 receptors on the human umbilical vein endothelial cell line ECV304. Br. J. Pharmacol., 125, 357-364.
- Geoffrey Burnstock, Maria-Pia Abbracchio, Jean-Marie Boeynaems, José L. Boyer, Stefania Ceruti, Marta Fumagalli, Christian Gachet, Rebecca Hills, Robert G. Humphries, Kenneth A. Jacobson, Charles Kennedy, Brian F. King, Davide Lecca, Maria Teresa Miras-Portugal, Gary A. Weisman. (2010). P2Y receptors. IUPHAR database (https://www.iuphar-db.org/ DATABASE/FamilyMenuForward?familyId=52).
- Law, C., Lydford, S.J. & Henderson, D.J. (1998). Characterisation of the P2-receptor(s) on ECV304 endothelial cells using FLIPR. NaunynSchmeidebergs Arch. Pharmacol. 358, R126.
- Zhang, J-H., Thomas, T.D.Y. and Oldenburg, K. R. (1999). A simple statistical parameter for use in evaluation and validation of high throughput screening assays. J. Biomol. Screening, 4, 67–73.
Learn more about FlexStation 3 Multi-Mode Microplate Reader >>