
Application Note
EarlyTox Live/Dead Assay Kit on SpectraMax Fluorescence Microplate Readers
- Simple workflow— direct measurement in wells with or without medium removal
- Increased throughput with microplate format
- Preconfigured protocol in SoftMax Pro Software
Introduction
Cell viability assays are often performed to assess the effects of a variety of treatments, including drug candidates, pathway activators and inhibitors, and reporter genes. One of the most popular methods for assaying cell viability is fluorescence detection on a microplate reader. Here we report the use of the EarlyTox™ Live/Dead Assay Kit in combination with SpectraMax® fluorescence microplate readers (Figure 1).
The EarlyTox Live/Dead Assay Kit contains two markers for live or dead cells that are suitable for use with mammalian cells. Calcein AM is a widely used live-cell marker. The non-fluorescent calcein AM permeates the intact cell membrane and is converted into calcein, the fluorescent form, by intracellular esterases. Live cells are stained with intense green fluorescence in the cytosol. For cell proliferation assays, or other assays where only live cell staining is desired, calcein AM can be used as a standalone reagent as provided in the EarlyTox™ Live Cell Assay Kit (P/N R8342 for Explorer kit, P/N R8343 for Bulk kit).
Ethidium homodimer-III (EthD-III) is virtually non-fluorescent and impermeant to an intact plasma membrane. In the event of compromised cell membrane integrity that is associated with cell death, EthD-III enters cells and binds to nucleic acids, resulting in bright red fluorescence in dead cells. Cytotoxic events that affect cell membrane integrity can be accurately assessed using this method.
Fluorescent signals from calcein and EthD-III can be detected using a SpectraMax fluorescence microplate reader and rapidly analyzed using a preconfigured protocol in SoftMax® Pro Software to determine the relative amounts of live and dead cells.
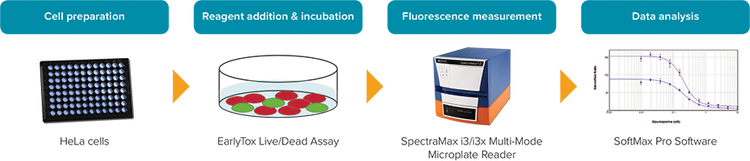
Figure 1: EarlyTox Live/Dead Assay workflow.
Materials
- EarlyTox Live/Dead Assay Kit
- Explorer Kit (2-plate size): Molecular Devices P/N R8340
- Bulk Kit (10-plate size): Molecular Devices P/N R8341
- HeLa cells (ATCC P/N CCL-2)
- Staurosporine (Sigma P/N S5921)
- 96-well black, clear-bottom microplates (Corning P/N 3904)
- SpectraMax fluorescence microplate reader
Methods
HeLa cells were plated at 15,000 cells per well in 100 µL of medium in a black, clearbottom microplate. They were allowed to attach and grow overnight in a 37°C, 5% CO2 incubator. The cells were then treated for 24 hours with 1:2 dilutions of staurosporine from 10 µM down to 0.01 µM to induce apoptosis. Four replicates were run at each concentration.
A 2X working solution of calcein AM/EthD-III was prepared by adding calcein AM and EthD-III stock solutions to PBS for a concentration of 6 µM for each dye. 100 µL of the 2X working solution was added to each assay well, resulting in a final volume of 200 µL and a final concentration of 3 µM for each dye. The plate was incubated at room temperature for 50 minutes or 2.5 hours. It was then read from the bottom on a SpectraMax® i3 Multi-Mode Microplate Reader using a preconfigured protocol in SoftMax Pro Software with the settings indicated in Table 1. Note: removal of medium, followed by addition of a 1X solution of calcein AM and EthD-III, is optional and can help reduce background fluorescence if necessary.
Lm1: Ex = 495 nm, Em = 530 nm
Lm2: Ex = 530 nm, Em = 645 nm
PMT gain: Automatic
Flashes per read: 6
Read from bottom
Table 1. Settings for SpectraMax i3 Multi-Mode Microplate Reader. Similar settings will work for other SpectraMax microplate readers with fluorescence detection. Bottom read is recommended, but if this feature is not available, top read may be used.
The preconfigured EarlyTox Live/ Dead Assay protocol in SoftMax Pro Software automatically calculates green/ red ratios, which can then be plotted against experimental conditions such as compound concentration. The protocol also enables calculation of percentage of live and dead cells in the experimental cell samples. For these calculations it is necessary to set up additional controls in the assay plate1.
Results
HeLa cells treated with staurosporine showed a clear concentration response, which was easily quantified as the ratio of live (green fluorescence) to dead (red fluorescence) signal (Figure 2). Overall, RFU values were higher for cells incubated for 2.5 hours than for cells incubated for 50 minutes. However, the fold increase in green/red ratios with staurosporine treatment was the same for both time points. This stability in the fold increase over time allows for flexibility in the incubation time with consistent results. In both cases the EC50 values were comparable at 200 nM and 207 nM, respectively
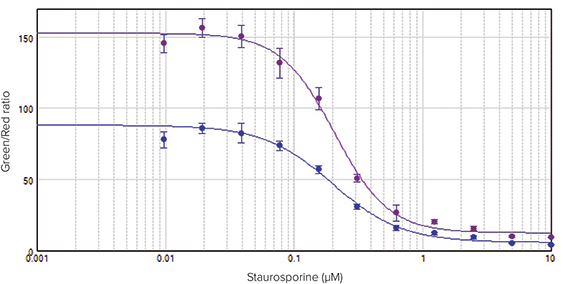
Figure 2. Concentration response curves for HeLa cells treated with staurosporine for 24 hours. Cells were incubated in calcein AM and EthD-III for 50 minutes (•) or 2.5 hours (•). Concentration curves were plotted using the ratio of green (530 nm emission) over red (645 nm emission) RFUs at the Y-axis. A 4-parameter curve fit was applied in SoftMax Pro Software. EC50 values were 200 nM for the 50-minute incubation and 207 nM for the 2.5-hour incubation.
Conclusions
Used together with SpectraMax microplate readers, the EarlyTox Live/Dead Assay Kit enables direct measurement of live and dead cells with a simple workflow and the increased throughput offered by a microplate format. Consistent results are obtained over a wide range of incubation times, offering workflow flexibility. A preconfigured SoftMax Pro Software protocol provides optimized instrument settings and speeds the time to results with automatic data analysis.
Reference
- EarlyTox Live/Dead Assay Kit product insert