
Application Note
Custom Module Editor For MetaXpress High Content Image Acquisition and Analysis Software
- Create simple step-by-step custom analysis
- Tailor object segmentation and classification
- Find objects localized within special cell compartments
- Report only measurements of interest
- Analyze faster than acquisition
For MetaXpress High Content Image Acquisition and Analysis Software
Introduction
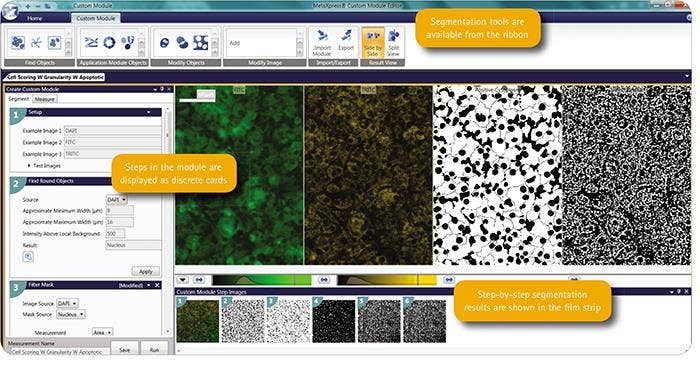
The Custom Module Editor in version 5 of MetaXpress® Software is a flexible, interactive environment where users can create and test a template for image analysis. Galleries of processing options, morphology filters, application modules, and segmentation methods are available for users to construct a sequence of analysis steps. The new Click-to-Find Tool enables easy object identification and auto-populates step card parameters. Once created, custom modules can be easily shared and re-used to analyze other image sets.
Custom modules can be rapidly written to measure general and specific toxicity parameters. In addition to monitoring cell viability, apoptosis, autophagy and mitochondria membrane potential, a custom module allows you to simultaneously analyze tissue-specific toxic effects. The user decides which responses to detect and also which measurements to record out.
The Custom Module Editor enables more analyses, such as identifying objects within objects, creating morphometric classifiers for shape analysis, and analyzing both color and transmitted light images. With custom modules, researchers can simplify segmentation steps and report only on the data selected, saving unnecessary analysis time. Analysis time can be further accelerated by taking advantage of parallel processing using MetaXpress® PowerCore™ Software.
Cell migration custom analysis
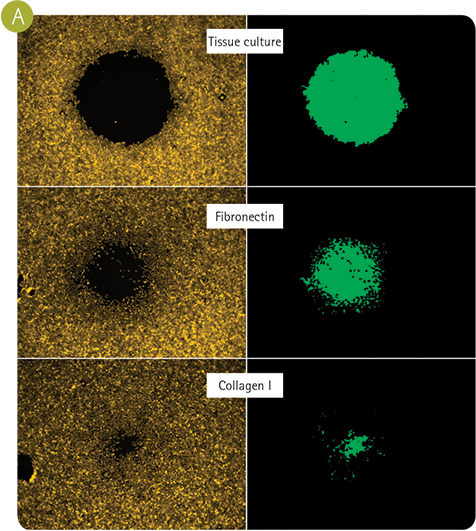
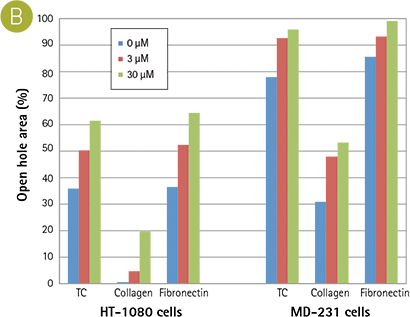
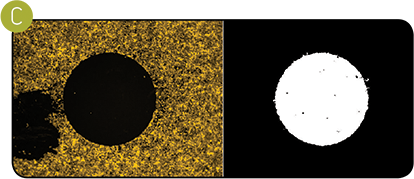
Oris Cell Migration Assay (from Platypus Technologies, LLC) with different surface treatments (A and B). With a custom module, not only can you accurately measure migration into a cell-free zone, but pipetting artifacts (C) can be omitted from the image analysis. Finding puncta in neurite outgrowths
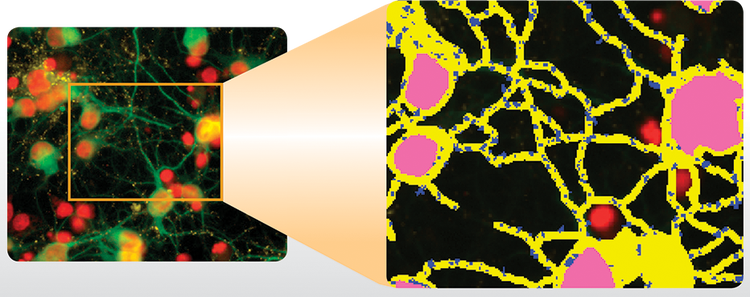
Pictured above is a custom module that counts puncta in neurite outgrowths. Additional parameters recorded were number of nuclei and number of outgrowths per cell. The segmentation overlay shows: yellow: neurites; dark blue dots: synaptic peptides; pink: nuclei. The custom module excluded non-neuronal nuclei from the analysis.
Creating a custom module
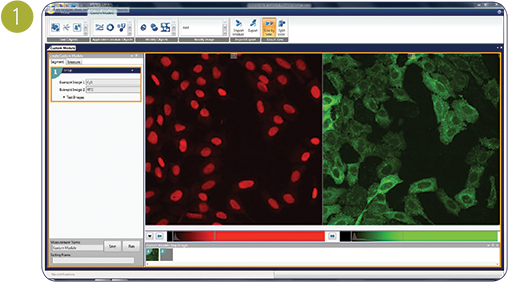
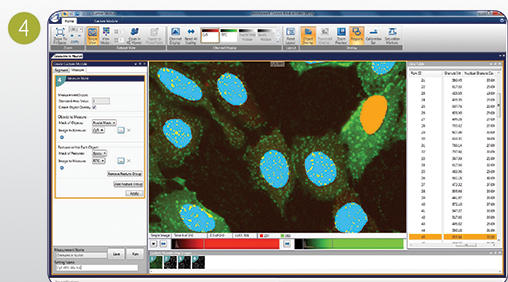
Shown is a sample of a custom module to find granules in nuclei using the Custom Module Editor.
- Select raw image in the segment tab.
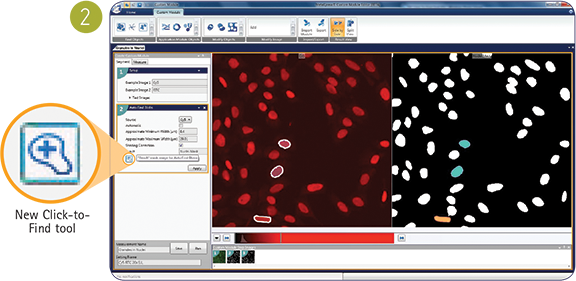
- Identify nuclei using the new Click-to-Find tool. Simply click on objects of interest and measurement parameters are updated automatically.
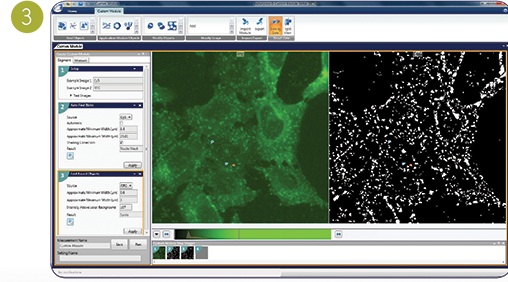
- Find spots with granule detection.
- Measure only granules within the nuclei mask.
Finding granules in nuclei
Pictured above is a custom module that counts puncta in neurite outgrowths. Additional parameters recorded were number of nuclei and number of outgrowths per cell. The segmentation overlay shows: yellow: neurites; dark blue dots: synaptic peptides; pink: nuclei. The custom module excluded non-neuronal nuclei from the analysis. Multi-parameter toxicity measurement of hepatocytes
One step of a multiple-parameter toxicity module can characterize the cells based on nuclear count, size, and number of apoptotic nuclei (image not shown). Another step measures the cell area and quantifies the mitochondria present in the cytoplasm.
Example measurements from a multi-parameter hepatotoxicity assessment:
- Total number of nuclei
- Number of apoptotic nuclei
- Size of nuclei
- Number of live cells (viability)
- Number of mitochondria/cell (counting granules in cytoplasm)
- Total amount of phospholipids/cell
IC50 curve: mitochondrial count per cell
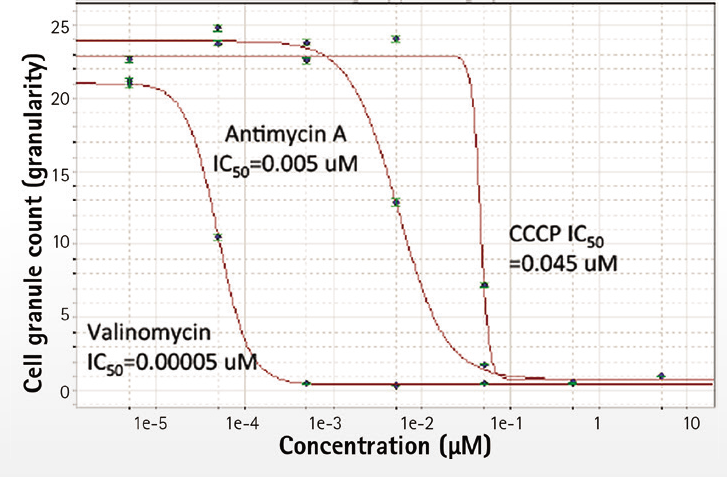
IC50 curves of each parameter can be plotted in AcuityXpress™ Software. Example shows mitochondrial count per cell.