
Application Note
3D analysis and morphometric characterization of compound effects on cancer spheroid cultures
- Perform high-throughput screening of spheroids for efficient and consistent acquisition
- Quantify and measure characteristics of more physiologically-relevant models
- Reduce analysis time using an integrated software solution
Introduction
Cellular transformation/tumorigenicity assays using cultures of cells in semi-solid media (soft agar or Matrigel) has been well established for cancer research1,2,5. The assay requires cells to grow in an anchorage independent manner, which is a hallmark of cancer cells. Compared with adherent cells grown in 2D monolayers, 3D growth conditions are believed to more accurately reflect the natural environment of cancer cells and span the gap between 2D cultures and animal studies3,5. Importantly, 3D assays correlated better with tumorigenicity in animals, e.g. mouse xenografts5. The growing interest in developing methods for personalized medicine, in which tumor cells from individual patients are tested for sensitivity to a panel of drugs4, has led to a need for more relevant, time-sensitive studies.
3D assays were formerly labor-intensive and inconsistent due to the subjective definitions of colonies and, non-suitable for high-throughput screening. In this study, we describe a method compatible with highthroughput screening, in which compound effects on cell growth in semi-solid media were measured and quantitated using high-content imaging and 3D analysis.
Experimental protocol amenable for screening
To prepare spheroid cultures in semi-solid media, human colon carcinoma HCT116 cells were pre-mixed with a solution of 4.25 mg/mL cold Matrigel (Corning) diluted in growth media and plated into 96-well half-area plates (Greiner) at a density of \~500 cells/well for a total volume of 25 μL. The plate was incubated for 30 minutes at 37°C to solidify the gel, followed by the addition of 25 μL of media. Within 24-48 hours, spheroid colonies formed in each well.
The resulting spheroid cultures were treated with anti-cancer compounds for 5 days. Compounds were diluted in media at 2X concentrations and 25 μL of a 6 point dilution series was added to triplicate wells. On day 3, we added fresh compound by exchanging half the media with 1X compound dilutions. At the conclusion of treatment with test compounds, cells were stained with a mixture of two dyes: final concentration 1 μM calcein AM and 5 μM Hoechst 33342 (Life Technologies). Dye solutions were prepared at 3X concentration and added directly to media without aspiration and incubated for 2 hours prior to imaging. In an alternative assay, cells were fixed for 1 hour using a 4% formaldehyde solution, washed 3x with PBS by removing half of the volume each time. Then the cells were stained with 5 μM Hoechst 33342 and 0.06 μM AlexaFluor-488 Phalloidin (Life Technologies).
Integrated confocal imaging and 3D analysis
Images were acquired using ImageXpress® Micro Confocal High-Content Imaging System, with a 20× Plan Fluor or 10× Plan Fluor objectives (Figure 1). A z-stack range of 100-150 μm was acquired with a series of 11-20 z-slices separated by 5-10 μm (for 10x magnification) or 2-5 μm (for 20x magnification). Two sites were imaged per well and all individual z-slices, as well as the 2D maximum projection image for each z-stack, were saved for 3D analysis (Figure 2).
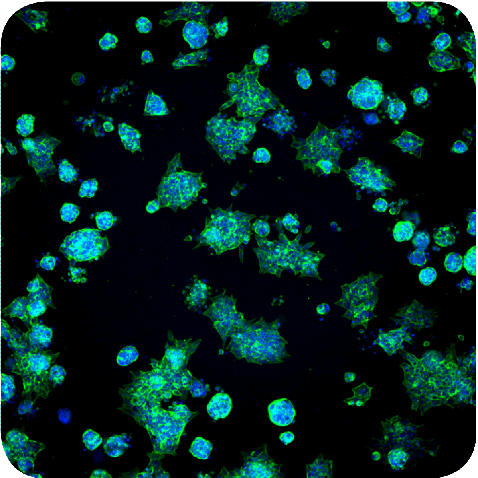
Figure 1. Maximum projection image of spheroids in Matrigel stained with Hoechst and AF488-phalloidin.
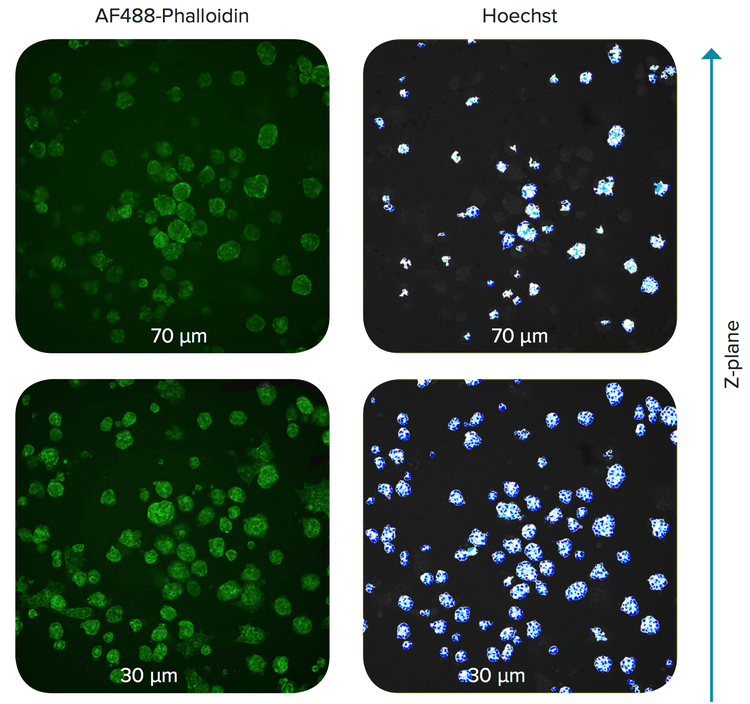
Figure 2. Z-planes of spheroids in Matrigel. The spheroids were stained with Hoechst and AF488- Phalloidin. Distance from the bottom of the well is indicated.
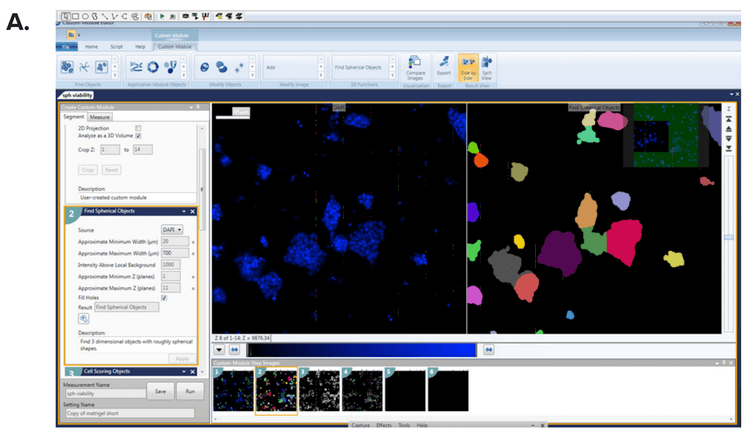
Images were analyzed using the 3D analysis module within the Custom Module Editor of MetaXpress® High- Content Image Acquisition and Analysis Software. Spheroids and individual cells were defined based on size and intensity. Then, spheroid size and phenotype were characterized by volume, diameter, and fluorescence intensities of cellular markers. Multi-parametric outputs were generated using a customized analysis module (Figure 3) and the readouts for each individual spheroid included measurements for nuclear count, size, volume, intensity, live cells per spheroid, whole cell volume and diameter, spheroid diameter, and average intensities of cellular markers (calcein AM, Phalloidin, or Hoechst). The readouts described above can be reported per individual object (spheroid) or averaged per well. Additional sites per well can be acquired to increase the number of cells scored. IC50 values were determined using a 4-parameter curve fit (Figure 4).
****
****
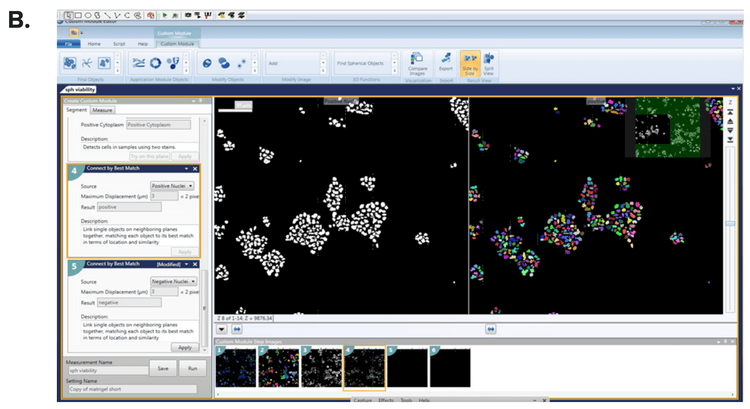
***Figure 3. Definition of spheroids using MetaXpress Custom Module Editor. (A)*The Count Nuclei and (B) Cell Scoring modules defined the spheroid count and individual cells were scored for each marker of interest.
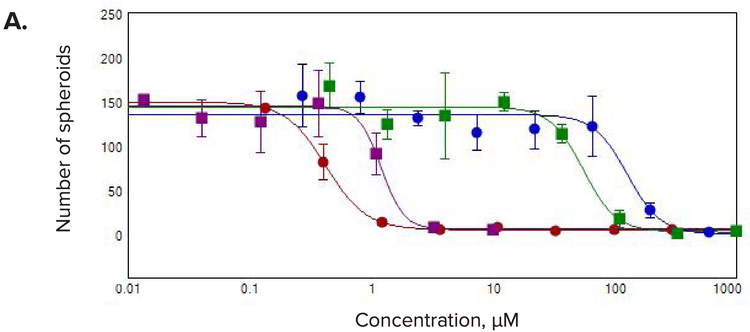
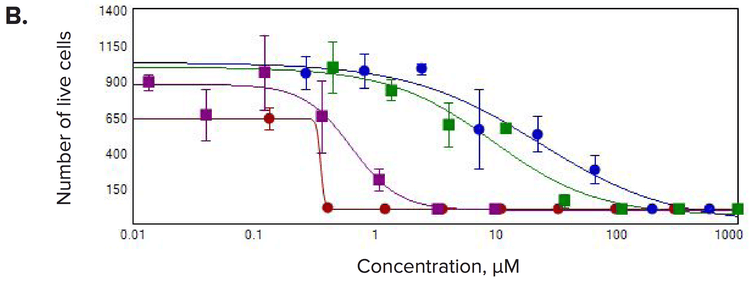
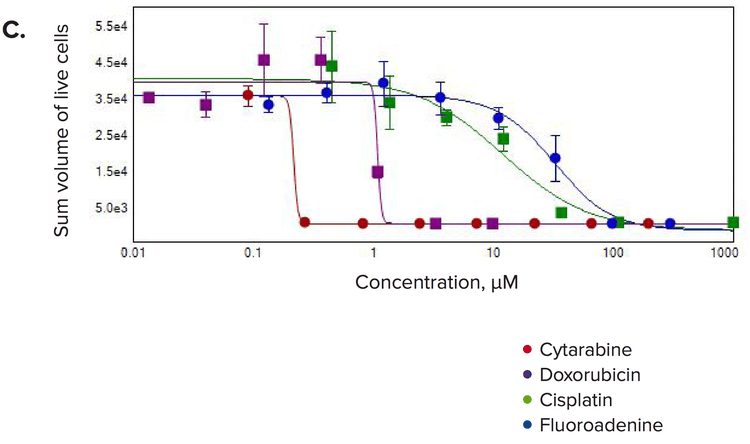
Figure 4. Concentration-responses for selected compounds. Measurements of (A) number of spheroids/well, (B) number of live cells/well, and (C) the sum volume of live cells/spheroid were calculated within the 3D volume.
Multiple 3D parameters show morphological effects of compound treatments
We observed significant changes after compound treatment. In general, there was a reduction in the number of spheroids, as well as the number of cells per spheroid consistent with expected anti-proliferative effects. We also observed a concentrationdependent decrease in the sum volume of live cells within each spheroid, the spheroid size, and the number of viable cells. The intensities for calcein AM or Phalloidin staining were dramatically reduced for the spheroid and also for individual cells. Measurements of the number of spheroids in the 3D volume were used to calculate the IC50 values showing the response to the anti-cancer compounds (Table 1).
IC
>50
, μM
Table 1. IC50 values measured for selected compounds using number of spheroid per well as a readout.
Summary
3D spheroid cell models combined with high-content 3D assays show promise as a screening tool for assessing compound effects, proliferation, and viability of cancer cells. Assays can be used for drug development, drug re-purposing, and personalized medicine.
Resources
- Grenman, R., Burk, D., Virolainen, E., Buick, R.N.; Church, J.; Schwartz, D.R.; and Carey, T.E. (1989). Clonogenic cell assay for anchorage-dependent squamous carcinoma cell lines using limiting dilution. International Journal of Cancer, 44(1), 131–136.
- MacPherson, I., & Montagnier, L. (1964). Agar suspension culture for the selective assay of cells transformed by polyoma virus. Virology, 23, 291–294. Retrieved from Pubmed.
- Pampaloni, F., Reynaud, E. G., & Stelzer, E. H. (2007). The third dimension bridges the gap between cell culture and live tissue. Nature Reviews Molecular Cell Biology, 8(10), 839-845. Retrieved from Pubmed.
- Rotem, A., Janzer, A., Izar, B., Ji, Z., Doench, J. G., Garraway, L. A., & Struhl, K. (2015). Alternative to the soft-agar assay that permits high-throughput drug and genetic screens for cellular transformation. Proceedings of the National Academy of Sciences, 112(18), 5708-5713.
- Shin, SI., Freedman, VH., Risser, R., & Pollack, R. (1975). Tumorigenicity of virus-transformed cells in nude mice is correlated specifically with anchorage independent growth in vitro. Proceedings of the National Academy of Sciences, 72(11), 4435–4439. Retrieved from Pubmed.
Learn more about the ImageXpress Micro Confocal High-Content Imaging System >>