
Application Note
Improve nuclear translocation assay results using image deconvolution
- Enhance image resolution with 2D on-the-fly image deconvolution
- Quantitate nuclear translocation easily with a preconfigured translocation analysis
- Increase statistical significance of data using deconvolved images
Matthew Hammer | Applications Scientist | Molecular Devices
Introduction
Widefield microscopy is a powerful tool that has been utilized to investigate cellular and molecular processes involved in cell signaling. Although fluorescent blurring from out-of-focus light is an innate result from all widefield microscopes, image deconvolution algorithms can reverse this out-of-focus light artifact. As a result, images and fine detail become sharper while maintaining quantitative information.
The NF-κB signaling pathway has become a paradigm for studies into cell signaling and gene regulation.1 This is due to NF-κB expression in almost all cell types and due to its involvement in vital cellular processes like apoptosis, proliferation, inflammation, and innate and adaptive immune responses. Furthermore, NF-κB has garnered much attention as a drug screening target, because its dysregulation has been linked to various diseases including autoimmune diseases and cancer.2 Following activation by cytokines, bacterial antigens, viral particles, or cytotoxic stimuli, the NF-κB signaling pathway culminates with NF-κB translocating from the cytoplasm to the nucleus where it can regulate the transcription of a variety of genes.
Here, we tested the effects of TNF-α treatment time on the nuclear translocation of NF-κB in HeLa cells. Cells were imaged with the ImageXpress® Pico Automated Cell Imaging System and CellReporterXpress® Image Acquisition and Analysis Software. Images were captured with Digital Confocal 2D on-the-fly image deconvolution as well as in the standard widefield mode to demonstrate the improved statistical significance of analysis results from deconvolved images.
Materials
- HeLa cells
- RPMI media (Corning, cat. #10-104-CV) + 10% FBS + 1% pen/strep
- 96-well black wall, clear bottom microplate (Corning, cat. #3904)
- Block and Permeabilization Buffer (PBS + 5% donkey serum + 0.2% TritonX-100)
- Antibody Dilution Buffer (PBS + 1% donkey serum + 0.02% TritonX-100)
- TNF-α (Millipore Sigma, cat. #H8916)
- Hoechst 33342 (Invitrogen)
- NF-κB (RelA) primary antibody (ProteinTech, cat. #10745-1-AP)
- AlexaFluor 488 donkey anti-rabbit secondary antibody (ThermoFisher, cat. #R37118)
- AlexaFluor 594 phalloidin (ThermoFisher, cat. #A12381)
- ImageXpress Pico Automated Cell Imaging System
- CellReporterXpress Image Acquisition and Analysis Software
Methods
HeLa cells were plated into a black-wall, clear bottom 96-well plate at 5,000 cells/well in RPMI media. The plate was incubated at 37°C, 5% CO2 for 24 hours to allow for cell attachment and growth. Cells were then treated with TNF-α (1500 ng/ml) for 0, 15, 30, 45, or 60 minutes, and treatments were run in quadruplicate.
After treatment, the plates were washed twice with PBS and then fixed with 4% formaldehyde for 10 minutes. The cells were then washed three times with PBS, blocked and permeabilized for 60 minutes, and then immunolabeled with RelA (subunit of NF-κB) primary antibody (1:200) and AlexaFluor 594 phalloidin (1:50) overnight at 4°C. The staining solution was then removed from all the wells, and a secondary antibody (AlexaFluor 488 donkey anti-rabbit antibody) staining solution was added to every well at a 1:500 concentration for two hours at room temperature. For the last 30 minutes of the secondary antibody staining step, Hoechst 33342 was added to every well at 1μL/mL. The cells were then washed three times with PBS prior to imaging.
Imaging with Digital Confocal for enhanced image resolution
Imaging was performed on the ImageXpress Pico system twice, once with the Digital Confocal feature enabled and once in standard widefield mode (Figure 1). The 40X objective was used, and 25 sites were imaged per well. Stitching acquisition protocols were run, so that the images would be stitched as they were being acquired. The same exposure times were used for both acquisition modes, and the exposure times for each channel were 10 ms for DAPI and 300 ms for FITC and Texas Red.
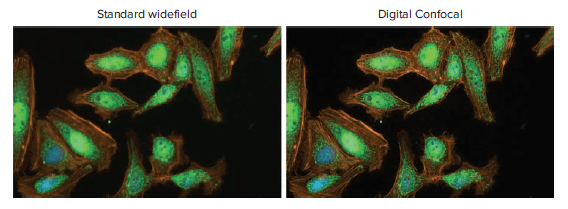
Figure 1. Representative standard widefield and digital confocal images of NF-κB nuclear translocation in HeLa cells treated with TNF-α for 30 minutes. Images were captured with the 40X objective and the DAPI, FITC, and Texas Red channels. Digital confocal 2D on-the-fly deconvolution helped to remove out-of-focus light, thereby increasing image resolution. The HeLa cells were stained with Hoechst 33342 (nuclei, blue), AlexaFluor 594 phalloidin (actin, orange), and immunolabeled for RelA (RelA, green).
Nuclear Translocation Analysis
The preconfigured translocation analysis module in CellReporterXpress software was used to measure the movement of NF-κB from the cytoplasm to the nucleus (Figures 2 and 3). The Hoechst 33342 stained nuclei were defined as the compartments, and the NF-κB proteins were designated as the probe. A Pearson’s correlation coefficient value of 0.6 was used to define nuclei positive for translocation. Cells that had a correlation greater than or equal to 0.6 were deemed positive for translocation. The Pearson’s correlation coefficient is a measure of the pixel intensity of the two stains in the designated compartment—in this case, the nucleus. A value of 1 represents two stains that perfectly overlap and a value of 0 indicates that the stains do not overlap.
Effect of treatment time on NF-κB nuclear translocation
TNF-α treatment time had a clear effect on the percent of cells positive for NF-κB translocation. The 30- and 45-minute treatment groups had the highest percent of translocation events, while the 60-minute group had the lowest (Figures 2 and 4). This indicated that after 45 minutes of TNF-α exposure, NF-κB began to relocate from the nucleus back to the cytoplasm. These results were captured in both digital confocal and standard widefield images.
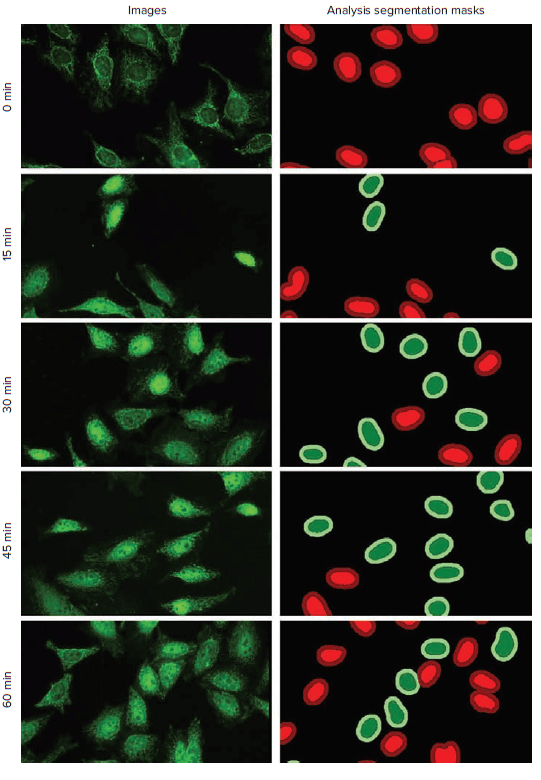
Figure 2. Time-dependent effects of TNF-α treatment time on NF-κB nuclear translocation. HeLa cells were treated with 1500 ng/ml of TNF-α for 0, 15, 30, 45, and 60 minutes. Images and analysis segmentation masks are from the dataset that was captured with the Digital Confocal mode. The FITC channel images (RelA) are presented here. NF-κB nuclear translocation from cytoplasm into the nucleus was analyzed with the translocation analysis module in CellReporterXpress software: positive inner area (dark green), positive outer area (light green), negative inner area (light red), and negative outer area (dark red).
Translocation analysis of digital confocal and standard widefield images
There were noticeable differences in the analysis results between the standard widefield and digital confocal datasets. Most notably, the standard deviation values for the standard widefield data were higher than those for the digital confocal data (Figure 4). For the 45- and 60-minute treatment time data, the analysis of standard widefield images produced higher percentages of translocation positive cells. This phenomenon was in part due to out-of-focus light from the cytoplasm above and below the nucleus leading to the identification of false positives (Figure 3A). The Digital Confocal 2D on-the-fly deconvolution algorithm helps to remove the out-of-focus light, giving a more accurate representation of the light from one single z-plane. This allowed for the position of the NF-κB molecules to be determined more precisely, leading to improved statistical significance in the analysis results from the deconvolved images. Additionally, the increased contrast and signal-to-noise ratios in the digital confocal images aided in accurately identifying translocation events as compared to standard widefield images (Figure 3B).
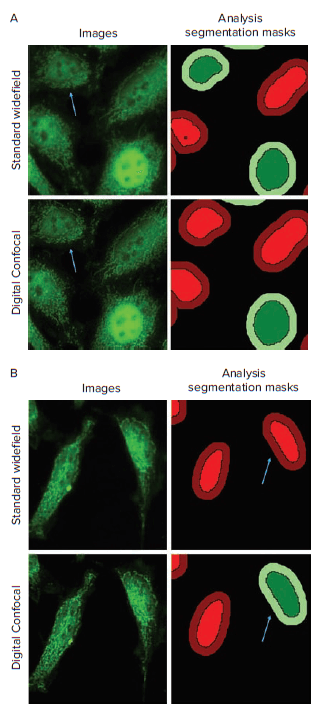
Figure 3. Translocation analysis of standard widefield and digital confocal images. Digital Confocal 2D on-the-fly image deconvolution helps to reverse the out-of-focus light artifact from widefield imaging, leading to increased statistical relevance and accuracy from image analysis. A. Arrows indicate cells that were identified as positive for translocation in the standard widefield image and negative in the digital confocal image. B. Arrows indicate cells that were identified as negative for translocation in the standard widefield image and positive in the digital confocal image. Images are from the 30-min TNF-α treatment group.
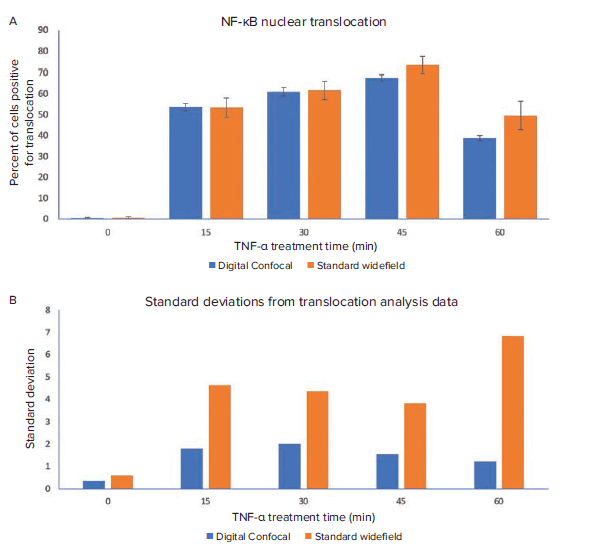
Figure 4. Effect of TNF-α treatment time on NF-κB nuclear translocation. Standard widefield and digital confocal images were analyzed with optimized translocation modules in CellReporterXpress. A. The percent of translocation positive cells from the analysis of both image datasets are compared here. B. The standard deviations for each data point are shown above. Analysis of images acquired using digital confocal yielded better reproducibility as seen by significantly lower standard deviations between replicates.
Conclusion
Assays requiring precise identification of sub-cellular structures or molecules within different compartments of the cell can benefit from the ability of on-the-fly image deconvolution to improve identification of the specific fluorescence signal against potentially high background caused by out-of-focus light. We utilized the ImageXpress Pico system and CellReporterXpress software to assess the translocation of NF-κB from the cytoplasm to the nucleus of HeLa cells upon treatment with TNF-α. A comparison between images generated using standard widefield versus Digital Confocal 2D on-the-fly image deconvolution highlighted the utility of the Digital Confocal feature in the measurement of NF-κB nuclear translocation events. The enhancement in image resolution and maintenance of quantitative information led to greater statistical significance in the analysis results from the digital confocal images.
References
- Wan, F., & Lenardo, M. J. (2010). The nuclear signaling of NF-kappaB: current knowledge, new insights, and future perspectives. Cell research, 20(1), 24–33. doi:10.1038/cr.2009.137
- Oeckinghaus, A., & Ghosh, S. (2009). The NF-kappaB family of transcription factors and its regulation. Cold Spring Harbor perspectives in biology, 1(4), a000034. doi:10.1101/cshperspect.a000034