
Application Note
Evaluate anti-inflammatory compounds using a multiparametric THP-1 cell-based assay
- Measure multiple analytes where sample volume is limited
- Reduce reagent use by 5-10X and deliver results in less than three hours
- Observe macrophage differentiation using automated imaging
Introduction
Oksana Sirenko, PhD | Sr. Research Scientist | Molecular Devices
Cathy Olsen, PhD | Sr. Applications Scientist | Molecular Devices
Evan Cromwell, PhD | CEO | Protein Fluidics
Macrophages originate from blood monocytes that leave the circulation and penetrate various tissues where they differentiate into macrophages. They are involved in the removal of pathogens and phagocytosis of dead cells. In addition, they initiate inflammation by releasing cytokines that activate vascular cells and facilitate macrophage adhesion to blood vessels and migration into the tissues. Differentiated THP-1 cells have been widely used as an in vitro model of macrophages in studies of macrophage involvement in inflammatory responses.1 The human monocytic cell line THP-1 can be differentiated into macrophages by phorbol 12-myristate 13-acetate (PMA) and activated by bacterial lipopolysaccharides (LPS). Activated THP-1 cells change morphology and become more adherent. They also secrete inflammatory cytokines as a result of the cascade of cell signaling events initiated by LPS. The expression levels of cytokines are important physiological readouts for cell-based models of inflammation.
We present results from a multiparametric THP-1 cell-based assay. We used phenotypic imaging on the ImageXpress® Pico Automated Cell Imaging System to assess cell morphology and adhesion. We also used low-volume enzymelinked immunosorbent assays (ELISAs) run on the Pu·MA System, and detected on the SpectraMax® iD5 Multi-Mode Microplate Reader, to measure secreted cytokines and evaluate effects of compounds on inflammatory responses. The multiparametric assay workflow is shown in Figure 1.
An increase in IL-8, IL-1ß and TNF-α secretion was observed in THP-1 cells stimulated with PMA and LPS. To evaluate effects of anti-inflammatory compounds, cells were additionally treated with the p38 MAP kinase (MAPK) inhibitors SB202190 and pyrrolidine dithiocarbamate (PDTC), and the antibiotic moxifloxacin. SB202190 acts on the JAK/STAT and NFκB pathways2. The antioxidant PDTC suppresses activation of NFκB3. Moxifloxacin inhibits IL-8 and TNFα by inhibiting NF-κB, ERK, and JNK activation4. Inhibition of inflammatory responses by the compounds was measured by quantifying changes in cell adhesion and in cytokine and chemokine secretion. Concentration-dependent decreases in expression were seen for the selected compounds. Effects on cell morphology and adhesion were also assessed by phenotypic analysis of cell images.
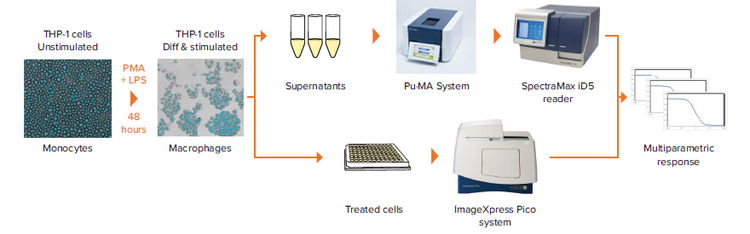
Figure 1. Multiparametric assay workflow. The ImageXpress Pico system, Pu·MA System, and SpectraMax iD5 reader are used to phenotypically image macrophage formation and quantify levels of secreted cytokines to evaluate effects of pharmacological compounds on the inflammatory response.
Materials
- THP-1 cells (ATCC)
- PMA (Sigma)
- LPS (Sigma)
- SB202190 (Sigma)
- PDTC (Sigma)
- Moxifloxacin (Sigma)
- ELISA antibody pairs for IL-8, IL-1ß, and TNFα (BioLegend)
- ImageXpress Pico Automated Cell Imaging System (Molecular Devices)
- Pu·MA System (Protein Fluidics)
- SpectraMax iD5 Multi-Mode Microplate Reader (Molecular Devices)
Methods
- THP-1 cells were plated at 20,000 cells per well of a 96-well microplate and incubated for 48 hours. They were then stimulated with a mix of PMA and LPS (0-5 pg/mL of PMA, and 0-100 pg/mL LPS) for 24 hours.
- Anti-inflammatory compounds were added two hours prior to stimulation.
- After incubation, 60 μL of supernatant was taken from each well for ELISA. The samples were analyzed fresh or stored at -70°C for subsequent analysis.
- Supernatants were diluted 3:1 in assay buffer and analyzed for IL-8, TNFα, and IL-1ß using the Pu·MA System flowchips and reagents. Results were detected using the absorbance mode of the SpectraMax iD5 reader.
- Cells were imaged with transmitted light (TL) using the ImageXpress Pico system. Non-adherent cells were removed by washing twice with media. Cells in TL images were counted using CellReporterXpress ™ Image Acquisition and Analysis Software.
Results
Upon stimulation with PMA and LPS, activated THP-1 cells adhered to the plate surface and upregulated cytokines. Cells were imaged using transmitted light with the ImageXpress Pico system to compare cell morphology before and after stimulation.
Phenotypic changes resulting from THP-1 stimulation are shown in Figure 2. Cell morphology changed from the small, rounded, non-adherent phenotype typically observed with monocytes to the larger, flatter, and more adherent macrophage phenotype. The number of adherent cells present after washing away the non-adherent cells was quantified using the ImageXpress Pico system and CellReporterXpress software.
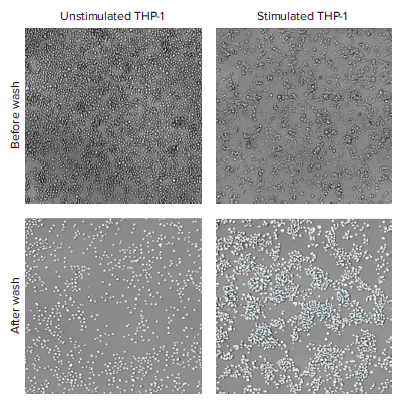
Figure 2. Transmitted light images of unstimulated (left) or stimulated (right) THP-1 cells before (top) and after (bottom) removal of non-adherent cells. Analysis masks for cell counting in CellReporterXpress software are shown in white (bottom).
The concentrations of the chemokine IL-8 and the cytokines IL-1ß and TNF-α secreted in response to cell stimulation were measured in supernatants using the automated, low-volume Pu·MA System. It uses small sample volumes (10-20 μL) and existing antibody pairs. This enables one to measure multiple analytes where sample volume is limited. Increases in chemokine and cytokine secretion with cell stimulation are shown in Figure 3. Levels of IL-8 increased 30-fold, IL-1ß increased 6-fold, and TNFα increased 15-fold in stimulated cells compared to unstimulated cells.
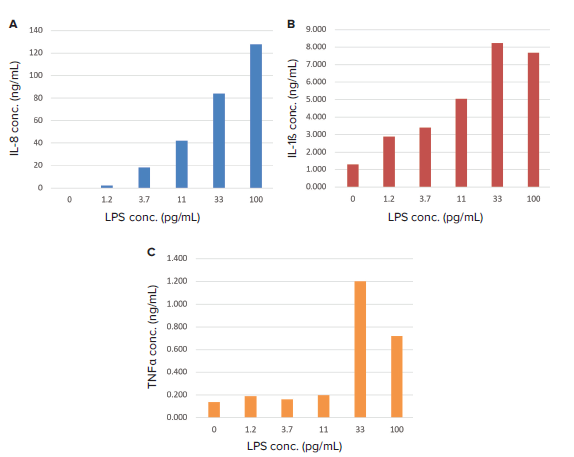
Figure 3. Chemokine and cytokine secretion in response to LPS. The concentrations of IL-8 (A), IL-1ß (B), and TNFα (C) increased in response to LPS
We investigated the effect of several anti-inflammatory compounds on cell morphology, adhesion, and secretion of IL-8 by stimulated THP-1 cells. Changes in cell morphology caused by anti-inflammatory compounds were imaged using the ImageXpress Pico system (Figure 4). To measure changes in cell adhesion in response to anti-inflammatory compounds, the number of adherent cells present before and after washing was determined by image analysis. Cells in the images were counted using CellReporterXpress software, and data were imported into SoftMax Pro Software so that EC50 values could be calculated using a 4-parameter curve fit. Supernatants from these cells were then assayed using the Pu·MA System and SpectraMax iD5 reader to determine the effect of anti-inflammatory compounds on secretion of the chemokine IL-8. Treatment with SB202190, PDTC, and moxifloxacin decreased IL-8 secretion in a concentration-dependent manner and resulted in a decrease in the number of adherent cells (Figure 5). EC50 values determined using a 4-parameter curve fit are shown in Table 1.
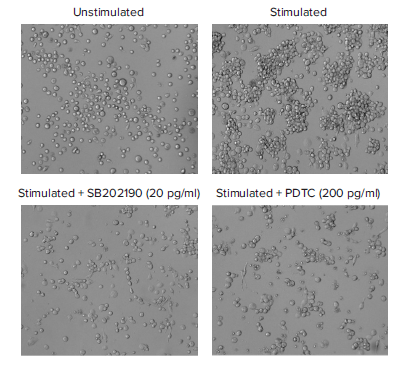
Figure 4. The effect of anti-inflammatory compounds on phenotypic response of THP-1 cells. Top: transmitted light images of THP-1 cells with or without PMA + LPS stimulation. Bottom: Stimulated cells incubated with anti-inflammatory compounds prior to PMA + LPS stimulation.
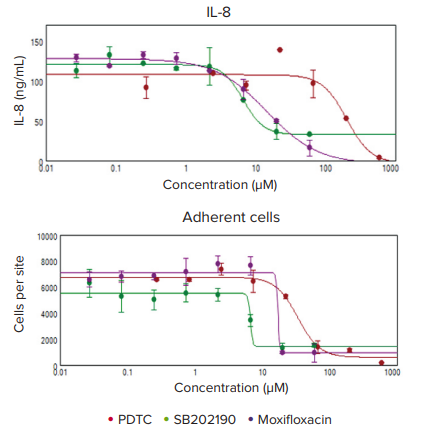
Figure 5. The effect of anti-inflammatory compounds on IL-8 levels and number of adherent cells.
EC
50
, μM
Table 1. EC50 values derived from a 4-parameter fit using SoftMax Pro Software.
Conclusion
We present a multiparametric inflammation assay that uses a THP-1 cell model with the ImageXpress Pico—an automated cellular imaging system—the Pu·MA System—a novel, low-volume automated ELISA system—and the SpectraMax iD5 microplate reader. Treated cells were imaged with the ImageXpress Pico system, and CellReporterXpress software was used to count cells that adhered in response to stimulation. The Pu·MA System was used to perform immunoassays with existing ELISA antibody pairs using a microfluidic flowchip that reduces reagent use by 5-10X and delivers results in less than three hours. ELISA results were detected on the SpectraMax iD5 reader and results were analyzed with SoftMax Pro Software. Using this workflow, we monitored changes in the secretion of chemokines and cytokines (IL-8, IL-1ß, and TNFα) in response to three anti-inflammatory compounds. Observed differences in chemokine and cytokine levels were consistent with published mechanisms of action.
References
- Optimized THP-1 differentiation is required for…; Park et al, Inflamm Res. 2007, 56, 45.
- p38α MAP kinase serves cell type-specific inflammatory functions…; Kim et al, Nat Immunol 2008, 9, 1019.
- PDTC is a potent antioxidant…; Zhu et al, FEBS Letters 2002, 532, 80.
- Anti-Inflammatory Effects of Moxifloxacin…; Weiss et al, Antimicrob Agents Chemother 2004, 48, 1974.