
Application Note
Analyze experimental results using curve fitting with MetaXpress 6.5 software
- Graph your data in the best possible way using one of multiple different curve fit options
- Simplify plate acquisition setup by consolidating key functions in one place.
- Always visible and always accessible plate layout views
Introduction
Matthew Hammer | Applications Scientist | Molecular Devices
The new Curve Fitting Algorithms in the MetaXpress® 6.5 (MX 6.5) High-Content Image Acquisition and Analysis Software were designed to facilitate data visualization and the secondary analysis of data. The software allows you to generate a curve of best fit to a series of data points. With multiple functions, including 4-parameter logistic, and multiple curve outputs, such as EC50 and benchmark response, an array of graphs and curves can be generated to best represent data. Here, we show how to generate dose-response relationship for defining the EC50 values of compounds using a toxicity assay as an example.
Multitoxicity assay using HeLa cells
Cells were plated at 2,000 cells/well in a 384-well black, clear bottom microplate, and then incubated at 37°C, 5% CO2 for 24 hours. Next the cells were treated, in quadruplicate, with anti-cancer compounds in a 1:3 serial dilution for 48 hours. Cells were stained with a solution of Hoechst 33342 (8 μM), MitoTracker Orange (100 nM), and Calcein AM (1.25 μM) for 30 minutes then imaged on the ImageXpress® Micro Confocal High-Content Imaging System. The live cell images were analyzed with the Multi-Wavelength Cell Scoring module in MetaXpress 6.5, which produces multiple readouts including total and average number, size, area, and intensity values for the cells or objects being measured as well as the % of cells positive for each wavelength. The data and graphs with curve fits were produced from the results.
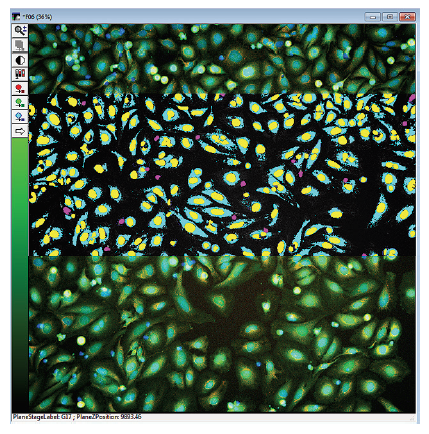
Figure 1. Images with superimposed analysis masks designating HeLa cells positive or negative for the live cell stain, calcein AM. The Multiwavelength Cell Scoring Analysis module was configured to segment, quantitate, and produce multiple readouts for cells positive for calcein AM and MitoTracker Orange. In the image overlay, the nuclei are in blue, live cells are in green, and mitochondria are in orange. The image analysis masks presented here are from the analysis of wavelength 2 (FITC), calcein AM. The calcein AM positive cell cytoplasm masks are in turquoise, the positive nuclei are yellow, and the negative nuclei are purple.
Curve fitting to enhance data analysis
The plate was annotated within MX 6.5 to create concentration response curves for interpreting the results of cell-based assays. Inside the Annotate Wells Window, we selected the group type (negative control, positive control, or test), input the name of the compound(s) used to treat the wells, and entered the starting concentration for the compound and the value that corresponds to the dilution that was used to treat the cells. The positive and negative controls were used for Z calculation. The annotations for the plate can be saved either to the database or as a file that is saved on the computer, and then applied to a specific plate that has been acquired.
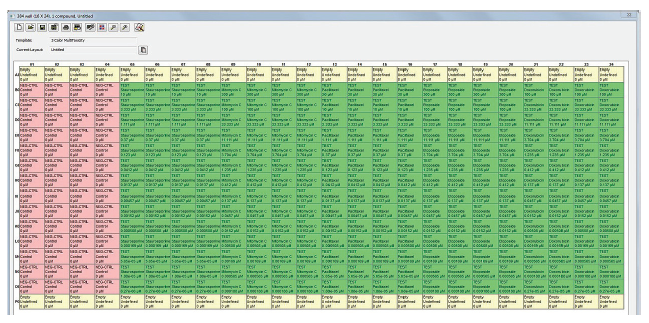
Figure 2. Configured plate annotation file for the 3 color multi-toxicity assay. The plate was created in the Plate Annotation window in MX 6.5 and the annotation contained the compounds and the dilutions that were used in the assay. The annotation is used for the creation of concentration response curves with curve fits.
To create graphs from an analyzed and annotated plate, we navigated to the Graph tab and selected a measurement to plot. In this example, we selected to display Measurement (positive cells) vs. Concentration (μM compound). Once the graph has been designed to our liking, we selected the Curve Fit button to add a curve that accurately traces the data. You can select from a menu of over a dozen fits to choose one that best represents your data. In this case, where we want to analyze dose-responses, we selected a 4-Parameter Logistic curve and fit the curve around the mean for the data points, ensured that the Asymptotic option was selected, and specified EC50 for the readout.
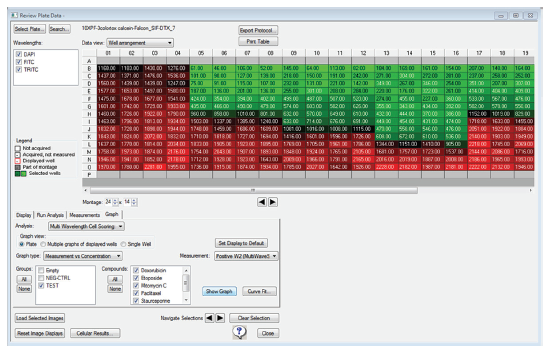
Figure 3. Configure graph parameters within Review Plate Data. From the Graph tab of the MX6.5 software, select the graph type, measurement to plot, and samples to include. In the Graph type drop-down list, selecting measurement vs. concentration brings up the groups and compounds that were established in the plate annotation. The measurement that was selected for plotting was the total number of cells positive for wavelength 2, FITC (calcein AM).
We exported the data from the curve fit and selected measurements into tab delimited files and easily saved the graphs as picture files.
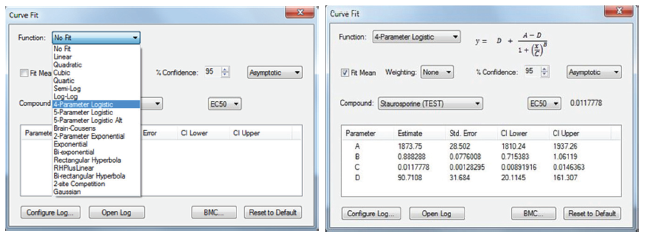
Figure 4. Select the appropriate curve fit function that corresponds to the results. Within the Curve Fit Window, the settings for the curve fit and the data that will be generated from the curve can be optimized. The 4-Paramter Logistic function and EC50 readout was selected to accurately represent the dose-response curve from the 3-color toxicity assay.
Conclusion
The utility of the curve fitting algorithm in MetaXpress 6.5 software was demonstrated by plotting live-cell responses to a dilution series of toxic compounds. The ability to annotate your plate, plot your data into a graph, and produce a variety of curves and readouts including IC50 values and benchmark dose or concentration for your compound is essential for numerous biological assays. The integrated curve fitting feature makes MX 6.5 an all-in-one image acquisition and data analysis software.
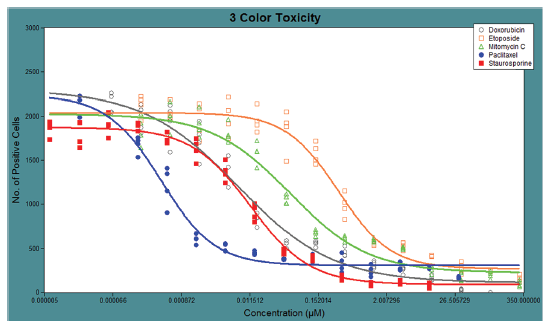
Figure 5. Dose-response curves of HeLa cells treated with cytotoxic compounds. The compound dose-response curves were well represented by the 4-Parameter Logistic fit from the Curve Fit Algorithm in MX 6.5. The EC50 values for each compound were generated from the fitted curves, and the EC50 values for each compound were as follows: Staurosporine (0.0118 μM), Mitomycin C (0.0527 μM), Paclitaxel (0.0004 μM), Etoposide (0.321 μM), Doxorubicin (0.0073 μM).