
Application Note
AI enabled phenotypic analysis of label-free intestinal organoids
- Simplified high-content imaging with step-by-step guided workflows
- Create deep-learning models in SINAP to segment label-free intestinal organoids
- Create classification rules to group segmented organoids following a user-friendly workflow
Zhisong Tong | Research Scientist | Molecular Devices
Prathyushakrishna Macha | Research Scientist | Molecular Devices
Introduction
Three-dimensional (3D) models such as spheroids and organoids are gaining popularity in many research areas because they are more representative of the in vivo environment compared to monolayer 2D culture models. Recent advances in organoid culture techniques have led to the ability to grow organ-like structures in 3D using either induced pluripotent stem cells (iPSC) or adult stem cells. The small intestine is a rapidly renewing tissue with a high turnover. Its major components reside in a single epithelial layer that alternates in major units, i.e., crypt and villus (Fig. 1). These crypts, or intestinal extensions, contains stem cells that divide and give rise to progenitor cells. Thus, the crypt is an important part of the intestinal organoid where mature organoids have more complex and numerous crypt structures.
Some of the application areas for organoids include drug discovery and regenerative medicine using high content screening approaches. Here we used the ImageXpress® Pico Automated Cell Imaging System with CellReporterXpress Automated Image Acquisition and Analysis Software to image intestinal organoids. CellReporterXpress reduces the complexity of highcontent imaging by providing built-in protocols with guided workflows for different applications. For example, new plate acquisition and stitched plate acquisition are two commonly used protocols for image acquisition with or without stitching of multiple images. The step-by-step guided workflows enable users new to imaging to set up their own acquisition protocols with ease. Protocols with customized settings can then be saved which allows users to perform one-click imaging later.
The ease of use in CellReporterXpress goes beyond image acquisition. The powerful image analysis software is capable of on-the-fly analysis. Users have the option to use one of the 25 pre-configured analysis protocols that include commonly used image analysis tools such as cell counting, live/dead analysis, neurite tracing and angiogenesis assay. In addition to the simplicity of the workflow, CellReporterXpress users can also perform advanced image analysis using artificial intelligence enabled tools in IN Carta® Image Analysis Software. IN Carta includes built-in algorithms for segmentation of common biological structures like nuclei, cells, puncta, fibers and neurites, as well as the optional module SINAP, a deep-learning based segmentation tool that enables users to create customized neural network models. In addition, IN Carta includes two classification tools. The manual decision tree classifier is based on user defined measures, and the Phenoglyphs classifier, is based on machine-learning algorithms
In this application note, we describe general approaches for using imaging and image analysis methods to describe and measure changes in phenotypes and the morphology of organoids. Methods can be applicable for any organoids, regardless of the origin or development protocols. In addition, we present a workflow for the imaging and analysis of intestinal organoids using the ImageXpress Pico automated cell imaging system together with CellReporterXpress and IN Carta image Figure 1. 2D Cartoon that shows the structure of intestinal organoid. analysis software. Particularly in IN Carta, SINAP-enabled image segmentation was followed by classification with Phenoglyphs. Using this approach, we demonstrate a simple method to image, analyze, and classify intestinal organoids into immature, intermediate, and mature classes. This AI-enabled classification approach can be used to monitor the growth and development of intestinal organoids in culture.
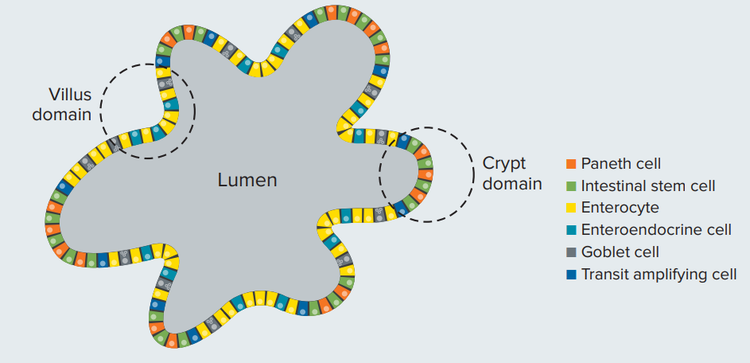
Figure 1. 2D Cartoon that shows the structure of intestinal organoid
Methods
Organoid imaging
A general workflow for organoid imaging is presented in Figure 2. Images of organoids were acquired with Transmitted light (TL) on the ImageXpress Pico system using CellReporterXpress. 2D projection of Z-stacking images were acquired with 10X objective, 10µm focus step, and well bottom autofocus. The focus offset was determined automatically by CellReporterXpress.
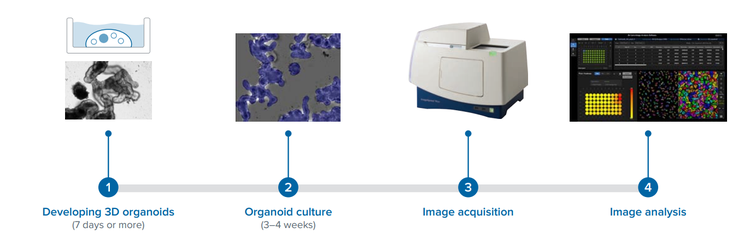
Figure 2. Workflow
Image analysis
Images were exported from CellReporterXpress into an IN Carta software-compatible format. SINAP, a deep learning-based segmentation module, was used to create a robust custom model with multiple images in the training set. This newly trained model was used to analyze all images thereafter. Phenoglyphs, a machine learning-based classification tool, was used to sort all acquired organoids into immature, intermediate, and mature classes.
Results
2D projection of 3D stacking images from CellReporterXpress
The images of mouse intestinal organoids were captured with the stitched plate acquisition protocol, which generates a stitched image from all sites within one well. Due to the 3D nature of intestinal organoids, the Z-stacking mode was selected and appropriate Z-planes were chosen to cover whole organoids. CellReporterXpress provides different Z-projection options for the transmitted light channel (average, best plane, best focus smaller objects and best focus large objects). The average Z-projection averages the intensities over all planes and best plane picks one plane with best focus, while the other two break up images into small zones to find the best focus across all Z-planes for each zone. Here we used and compared all four schemes for TL channel. Unlike other imagers where best focus is the preferred option, the best focus large objects and best focus smaller objects provide similar results with far superior image quality than average and best plane methods (Fig. 3) due to the random depth of organoids in Matrigel. Thus, the best focus large objects scheme was adopted as our Z-projection calculation scheme due to the less computational demand. For other similar complex structures, this 2D projection scheme for TL is recommended.
The captured 2D projection images for TL channel were then exported to IN Carta for subsequent analysis which can be done either during acquisition or post-acquisition. The size of the exported images was automatically adjusted to suit the IN Carta requirements with stitched images tiled into 2000x2000 pixels grid.
Generation of deep-learning models for intestinal organoids and crypts
Label-free imaging is an important tool for the study of biological processes without the use of fluorescent labels. However, automated analysis of images acquired with brightfield microscopy are challenging due to factors such as high background, shading effects, and artifacts from debris. To overcome these issues, we used SINAP, a deep learning-based segmentation tool in IN Carta.
Using SINAP, we developed two models for the analysis of intestinal organoids. We first trained a model to identify whole organoids. The training set was generated manually by labelling organoid and background regions using the brush and polygon tools within the SINAP interface. Due to good contrast between the organoids and background, 14 annotated images were sufficient to train a model by fine-tuning a previous model created for airway organoids (Fig.4A). The second model was trained to only segment crypts/extensions of the organoid. More careful annotations were required in this case and 23 training examples were sufficient to train a model by fine-tuning the first model (Fig.4B). Shape, intensity distribution, and local context were the key factors that allowed the SINAP model to achieve robust segmentation of the crypts without inclusion of the organoid core. Once models were trained, we set the whole organoids as a primary target and the crypts as one of the organelles targets to allow linking and reporting of the crypts within each organoid (Fig. 4C, Fig. 5A).
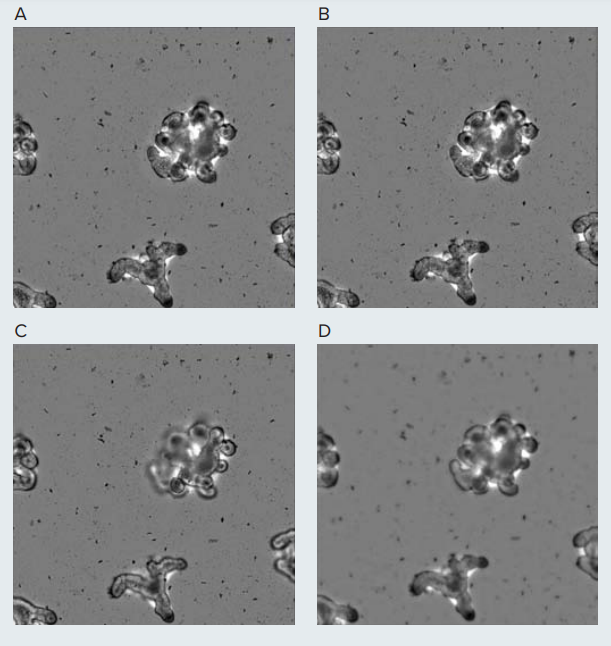
Figure 3. Transmitted light image of the intestinal organoid with 2D projection of (A) Best Focus Large Objects; (B) Best Focus Smaller Objects; (C) Best Plane; (D) Average
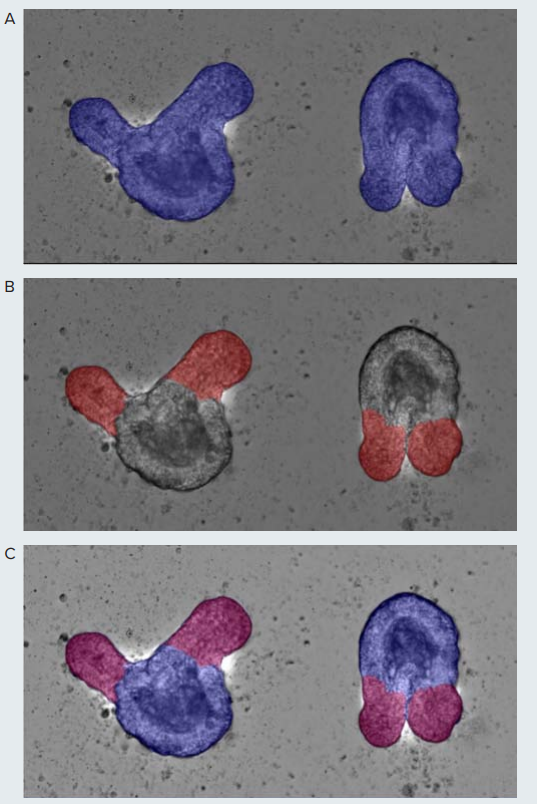
Figure 4. SINAP models are generated to annotate the masks for the whole organoid (A) and Crypts (B). (C) shows the overlap of the two masks. In the model, we used the whole organoids as the Primary Target and the crypts as the Organelles.
Classification of immature, intermediate and mature organoids with Phenoglyphs and Classifier
The images of mouse intestinal organoids were captured with the stitched plate acquisition protocol, which generates a stitched image from all sites within one well. Due to the 3D nature of intestinal organoids, the Z-stacking mode was selected and appropriate Z-planes were chosen to cover whole organoids. CellReporterXpress provides different Z-projection options for the transmitted light channel (average, best plane, best focus smaller objects and best focus large objects). The average Z-projection averages the intensities over all planes and best plane picks one plane with best focus, while the other two break up images into small zones to find the best focus across all Z-planes for each zone. Here we used and compared all four schemes for TL channel. Unlike other imagers where best focus is the preferred option, the best focus large objects and best focus smaller objects provide similar results with far superior image quality than average and best plane methods (Fig. 3) due to the random depth of organoids in Matrigel. Thus, the best focus large objects scheme was adopted as our Z-projection calculation scheme due to the less computational demand. For other similar complex structures, this 2D projection scheme for TL is recommended.
The captured 2D projection images for TL channel were then exported to IN Carta for subsequent analysis which can be done either during acquisition or post-acquisition. The size of the exported images was automatically adjusted to suit the IN Carta requirements with stitched images tiled into 2000x2000 pixels grid.
Generation of deep-learning models for intestinal organoids and crypts
Label-free imaging is an important tool for the study of biological processes without the use of fluorescent labels. However, automated analysis of images acquired with brightfield microscopy are challenging due to factors such as high background, shading effects, and artifacts from debris. To overcome these issues, we used SINAP, a deep learning-based segmentation tool in IN Carta.
Using SINAP, we developed two models for the analysis of intestinal organoids. We first trained a model to identify whole organoids. The training set was generated manually by labelling organoid and background regions using the brush and polygon tools within the SINAP interface. Due to good contrast between the organoids and background, 14 annotated images were sufficient to train a model by fine-tuning a previous model created for airway organoids (Fig.4A). The second model was trained to only segment crypts/extensions of the organoid. More careful annotations were required in this case and 23 training examples were sufficient to train a model by fine-tuning the first model (Fig.4B). Shape, intensity distribution, and local context were the key factors that allowed the SINAP model to achieve robust segmentation of the crypts without inclusion of the organoid core. Once models were trained, we set the whole organoids as a primary target and the crypts as one of the organelles targets to allow linking and reporting of the crypts within each organoid (Fig. 4C, Fig. 5A).
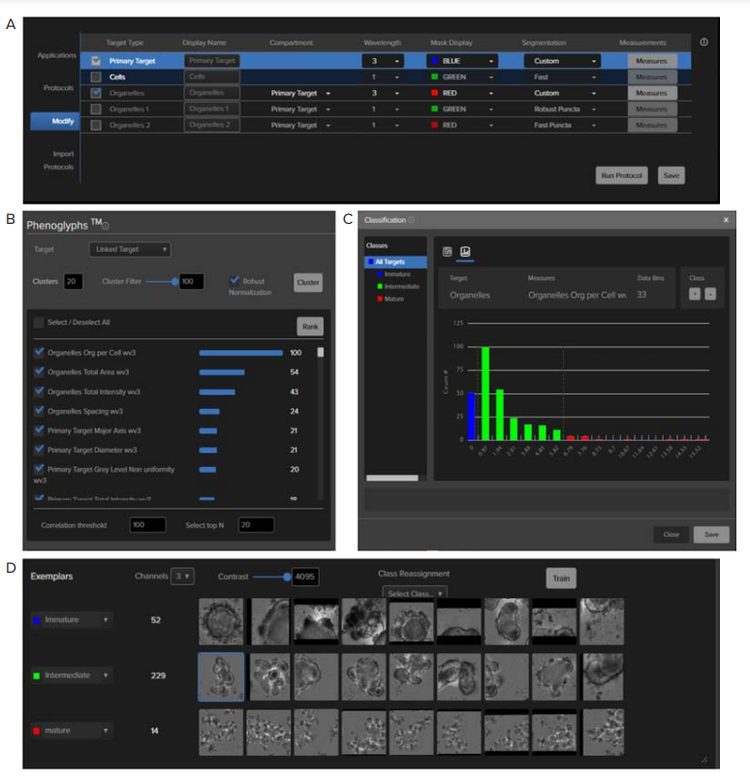
Figure 5. . (A) The whole organoid model was set as the Primary Target and the cript model was set as one of the Organelles (B) The ranking score indicates the importance of each measure in separating objects into specified classes. (C) Rule defined in Classifier tool based on a single measure(number of crypts per organoid). (D) Exemplars presented to the user in Phenoglyphs to define classes and make corrections of the misclassified objects.
Classification of immature, intermediate and mature organoids with Phenoglyphs and Classifier
Growth and maturation of intestinal organoids can be monitored with brightfield microscopy. Typically, after 3-5 days in culture, organoids start to elongate and by day 7 more mature, complex, multi-lobed structures (with multiple buds) can be seen. To quantify the number of mature and immature intestinal organoids in culture, we used Phenoglyphs, a machine learning tool, to classify the organoids based on their phenotypes.
With Phenoglyphs, users can select from a wide range of measurements that include the objects’ morphology, relative position, intensity, and texture. To define classification rules in Phenoglyphs, a preliminary set of phenotypical clusters was identified by a dedicated machine-learning algorithm. Next, we selected clusters representing the phenotypes of interest: immature, intermediate, and mature. An excessive number of clusters is recommended to reduce the heterogeneity within each cluster. In our case, we initially requested 20 clusters even though we expected only three phenotypic classifications.
Before the measurement, we had anticipated that the crypts-related measurement should contribute most to the classification since complexity implies more crypts. As expected, those measures were ranked as important ones to classify immature, intermediate, and mature organoids (Fig. 5B). We then used the top 20 measures to train the model with the results shown in Table 1. One may change the correlation threshold and top N as needed. As a recommendation, select the number of selected measure close to 4 * L, where L is the number of classes , and set the correlation threshold to 90 to eliminate redundant measures to avoid generation of a model which would be too specific for a current dataset. The representative images of organoids are listed in Figure 5D.
Table 1. Classification results based on Phenogplyphs and Classifier
Alternatively, the classifier can be used as a simpler and more straightforward classification that relies on individual measure(s) and lower/upper limits must be manually defined by the user. In this case, we chose the number of crypts per organoid (organelles org per cell) as a measure to specify classes. In Figure 5C we grouped organoids with 0 crypt as immature organoids and grouped organoids with 1 to 6 crypts as intermediate organoids, which are close to the statistics generated by Phenoglyphs (Table 1). For more complicated scenarios where two or more features dominate the classification, Phenoglyphs is the preferred approach. The summary results by well, by FOV, or by class and the single target data could be exported as .csv files and used for further analysis.
Conclusion
- ImageXpress Pico system enables fast and convenient high-content imaging with guided workflows.
- ISINAP is a powerful tool allowing users to segment objects, which are difficult to analyze with traditional image analysis algorithms
- Phenoglyphs enables robust classification of label-free organoids