
Application Note
3D cell-based assays using a novel fluidics flowchip technology and high-content imaging
- Demonstrate an automated workflow for 3D spheroid and organoid assays, compound testing, and disease modeling
- Use a combination of microfluidics system with high-content imaging to automate 3D cell culture, treatment, and analysis
- Get a variety of readouts from samples including analysis of cell phenotypes, viability, and secreted factors
Introduction
Oksana Sirenko, PhD | Sr. Research Scientist | Molecular Devices
Matthew Hammer | Applications Scientist | Molecular Devices
Michelle Leung | Scientist | Protein Fluidics
Evan F Cromwell | President & CEO | Protein Fluidics
Known as lab-on-a-chip systems, microfluidics gained popularity for its demonstrated success manipulating small volumes of fluid to control chemical, biological, and physical processes1–3. Over the last three decades, advancements in microfluidics have allowed scientists to maximize throughput and increase productivity while also ensuring the highest levels of accuracy and reproducibility in their drug discovery research.
3D systems are believed to have more in vivo relevance and perform as a predictive tool for the success or failure of a drug screening campaign4–8. Common advanced cellular models that researchers rely on include spheroids, tumoroids, structured co-cultures, and multicellular organoids4–6. These systems are found in many areas of the drug development pipeline― from Target ID to preclinical safety assessment. More common are phenotypic high-throughput screens using complex models like tumor organoids6 as they are more physiologically relevant than their biochemical counterparts, yet they can be both difficult to handle as well as to image7.
Researchers have been perfecting the formation and maintenance of various 3D models for understanding both disease and normal physiology4–8. Some of the limiting factors have been the ability to perform complex assays easily and quickly with these precious samples, especially with patient-derived material. Also, when manually performing drug treatments and assays in 96-well plates, one is limited by the number of readouts. The manual treatment, staining, and processing of spheroids and organoids is typically labor-intensive and prone to disruption or loss of samples.
Here, we describe the use of high-content imaging in combination with microfluidic-based Pu·MA System® (Protein Fluidics) to perform automated assays, imaging, and image analysis with 3D cell models. We introduce a new method that’s advancing the possibilities of drug discovery using microfluidics to automate 3D cell culture and cell analysis, allowing a hands-free process for media exchanges and treatments while simplifying and improving workflow.
Methods
Automated flowchip assay
The Pu·MA System device comprises a medium size box containing the pump, the user interface, and a plate chamber. The device easily fits into a standard tissue culture incubator (Figure 1).
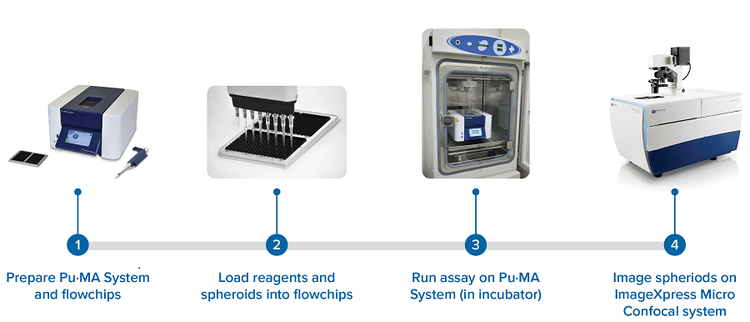
Figure 1. Flowchart of the workflow of automated organoid assay coupled with high-content 3D imaging.
The key component of the automation system is the Pu·MA System flowchip (Figure 1). The flowchips are designed with chambers and reservoirs in a convenient multi-well plate format (384-well plate standard) that are connected by microfluidic channels. Each flowchip has eight assay lanes with 10 connected wells; a plate of four flowchips provides 32 tests. Micro-tissues, media, compounds, or other reagents are preloaded to the flowchip by pipetting into the wells. Reagents can be loaded into the device by any 384-well compatible liquid dispensing system. Organoids are positioned into a special protected chamber at the bottom of the sample well. After sample loading, the plate is placed into the Pu·MA System and reagent exchanges are done automatically through the microfluidic channels. Multiple reagent exchanges can be performed enabling complex assay protocols and workflows to be run automatically. Typical assay protocols programs are preloaded into the system and can be selected with the touchscreen interface. Protocols can be modified according to user protocol. The Pu·MA System is then placed in an incubator to run the assays at 37°C and 5% CO2 (Figure 1).
Processing of 3D samples
The spheroids in this study, HCT116 cells (colon carcinoma cell line), HeLa (cervical carcinoma line), and HepG2 (hepatocyte carcinoma line) were incubated with and without compounds for 24–48 hours in the Pu·MA System. Several anti-cancer compounds (staurosporine, mitomycin C, cytarabine, 0.1–100 μM range, in duplicates) were preloaded into flowchips as aliquots of different concentrations in the cell culture media, and then were added to the 3D microtissues using automated media exchange. After drug treatments, the spheroid media was collected for secreted factors analysis. The spheroids were then stained within the flowchips, with aliquots of the appropriate dyes (see figure descriptions). Then the flowchip plate was taken out and imaged on the ImageXpress® Micro Confocal High-Content Imaging System (Molecular Devices).
In situ spheroid imaging
An automated organoid assay protocol for staining of cancer spheroids was done using the Pu·MA System (schematic shown in Figure 2). Cultured HeLa cell spheroids were stained for two hours in the flowchips within the Pu·MA System and then imaged within the flowchips using the ImageXpress Micro Confocal system, as shown in Figure 3. Images were acquired using widefield or confocal acquisition as previously described with a 10X Plan Fluor objective or 20X Plan Apo Lambda objective. A stack of 7–15 images separated by 10–15 μm was acquired, starting at the well bottom and covering approximately the lower half of each spheroid. Z-stack of images covered 100–200 μm for spheroids. We show that the streamlined automated staining protocol combined with high-content imaging produced high-quality confocal data. In the following example, we demonstrate a microfluidics system for automation of complex cell protocols with 3D samples, and compatibility with high-content imaging.
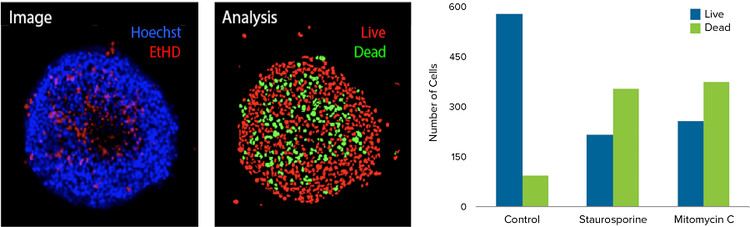
Figure 2. Image analysis of 3D spheroids using confocal imaging. HCT116 3D spheroids were incubated in the Pu·MA System with anti-cancer compounds as described in the Methods section. Then 3D spheroids were stained with EthD-1 dye and nuclear stain Hoechst and imaged using ImageXpress Micro Confocal system. Maximum projection image and analysis masks shown. The analysis masks show live cells nuclei (red), and dead cell nuclei (green). Bar graphs showing corresponding numbers of live and dead cells in spheroids treated with 1 μM of indicated compounds.
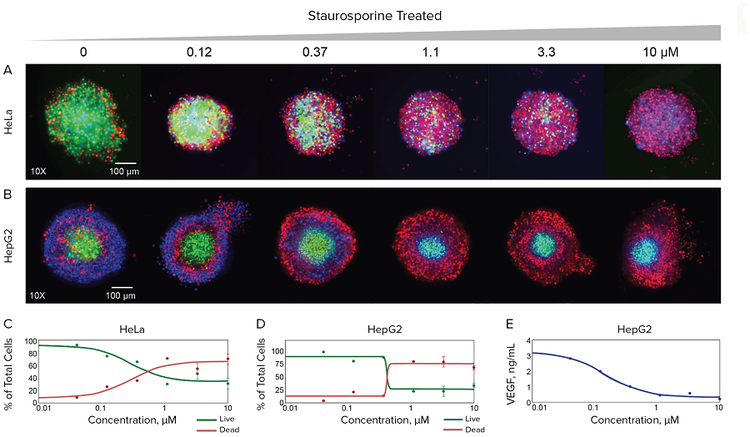
Figure 3. Imaging and quantitative assessment of the effect of staurosporine on spheroid morphology and viability assessed by high-content imaging. HeLa and HepG2 3D spheroids were incubated in the Pu·MA System with several anti-cancer compounds as described in the Methods section. 3D spheroids were stained with the combinations of several dyes and imaged using ImageXpress Micro Confocal system. Maximum projection images shown for control spheroids and spheroids treated with indicated increasing concentrations of staurosporine. HeLa cells were stained with Hoechst nuclear dye (blue), Calcein AM viability dye (green), and EthD-1 dead cells dye (red). HepG2 cells were stained with Hoechst nuclear stain (blue), EthD-1 dye (red), and NucView dye for apoptotic cells (green). Concentration-dependent plots shown below for percentages of live cells and dead cells quantitated in the images of spheroids for different concentrations of staurosporine. VEGF concentrations were quantitated in the same experiment in supernatants of HepG2 cells by ELISA.
Results
We studied the effects of different anti-cancer drugs by performing automated assays with 3D spheroids and microtissues using the novel microfluidic-based Pu·MA System and high-content 3D imaging using the ImageXpress Micro Confocal system. This provides a convenient application workflow for studying compound effects, oncology therapeutics, secretion of growth factors by single spheroid or organoid, as well as efficient processing of samples for metabolic profiling.
We automated a 3D assay protocol with cancer spheroids formed from HCT116 colon cancer cells to access the efficacy of selected anti-cancer drugs. The flowchip containing spheroids was loaded into a Pu·MA System that was then placed into a conventional cell incubator allowing prolonged culture of live cells. Importantly, the system enabled a handsfree cell culture process using automated compound additions, media exchanges, staining, and processing. Various media or reagents were preloaded into the chip reservoirs then moved automatically through the microfluidics chip, at pre-programmed time points, using pneumatic pressure. Specifically, a 48-hour cell culture protocol was performed automatically, which included two media exchanges with re-addition of compounds, then addition of viability dyes, and a final wash of the staining reagents after incubation. At that stage, spheroids were ready for imaging.
Because the flowchips have standard plate dimensions and are not connected to external tubes, they are compatible with various imaging instruments and plate readers, and were easily taken out of the Pu·MA System device to be imaged by the ImageXpress Micro Confocal system for imaging and analysis.
Confocal imaging provided 3D resolution of spheroid structures and complex analysis, allowing measurement of compounds’ impact on the size, volume, and integrity of, as well the number of total, viable, and affected cells. Advanced image analysis was made possible using high-content imaging tools that allowed characterization of nuclei, mitochondria, viability, and apoptotic markers.
To demonstrate the multi-readout capability of the Pu·MA System, two additional cancer spheroids made from HeLa and HepG2 cancer cells were assayed for cell viability and cell death in response treatments with selected cytotoxic drugs. HeLa spheroids, control or individually treated with mitomycin C (1–100 μM), valinomycin (0.1–10 μM) or staurosporine (0.1–20 μM) for 22 hours, were stained for two hours and then imaged within the flowchips. The acquired images of micro-tissues treated with staurosporine are shown in Figure 3. Numbers of total, live, and dead cells for control and treated with compounds were determined from the image analysis data and shown in the plots. Similarly, HepG2 spheroids, control or treated with different staurosporine concentrations (0.1–10 μM) for 44 hours, were stained for two hours and imaged (Figure 3). Cell numbers were plotted for live versus dead cells for different staurosporine concentrations (0.1 μM–10 μM). The media from the HepG2 spheroids treated with staurosporine was collected during the assay for subsequent secreted factor analysis. Changes in spheroid function were assessed by measuring Vascular Endothelial Growth Factor (VEGF) levels in the collected media using ELISA. This measurement showed good correlation to the effect of the staurosporine treatment of the spheroids. (Figure 3D).
The Pu·MA System provides a method to streamline a complex workflow of culture, treatment, staining and processing of 3D cultures. It also allows a seamless integration with high-content imaging workflow while increasing the accuracy of image quality and data.
Conclusion
We have demonstrated advantages of using the microfluidic Pu·MA System in combination with the ImageXpress Micro Confocal system to perform automated organoid/spheroid processing followed by an in situ staining and 3D confocal imaging within the flowchips. This system can also provide multiple readouts from a single sample, including secreted factor analysis.
Using streamlined workflows that allow automated processing of 3D samples, we demonstrated response to different drugs and drug concentrations via staining and imaging of several cell models. The workflow can be used for multiple applications including 3D spheroid and organoid assays, compound testing and disease modeling, processing patient-derived tissues, testing sensitivity of patient cells to drugs ex vivo, and a personalized approach for patient treatment.
- Plevniak K. Microfluidic technology: the next generation drug discovery tool. Drug Target Review. September 21, 2015. https://www.ddw-online.com/precision-medicine/p323447- harnessing-the-modified-proteome-for-increased-diagnosticpower. html (accessed July 20, 2020).
- Huang Y, Streets AM. Chip in a lab: Microfluidics for next generation life science research. January 30, 2013 https://europepmc.org/article/pmc/pmc3574129 (accessed July 20, 2020)
- Sackmann E, Fulton A, Beebe D. The present and future role of microfluidics in biomedical research. Nature. March 12, 2014, https://www.nature.com/articles/nature13118?page=43 (accessed August 5, 2020)
- Gupta N, Liu J, Patel B, et al. Microfluidics-based 3D cell culture models: Utility in novel drug discovery and delivery research. July 5, 2016. https://www.ncbi.nlm.nih.gov/pmc/ articles/PMC5689508/ (accessed July 20, 2020).
- Moffat JG, Vincent F, Lee, JA, Eder J, and Prunotto M; Opportunities and challenges in phenotypic drug discovery: an industry perspective. Nat Rev Drug Discov, 2017, 16, 531-543.
- Johnston 2019: Stanton JK, Close DA, Johnston PA. High Content Screening Characterization of Head and Neck Squamous Cell Carinoma Multicellular Tumor Spheroid Cultures Generated in 384-Well Ultra-Low Attachment Plates to Screen for Better Cancer Drug Leads. ADDT, 2019, 17, 17-36.
- Sirenko 2015: Sirenko O, Mitlo T, Hesley J, Luke S, Owens W, Cromwell EF. High-Content Assays for Characterizing the Viability and Morphology of 3D Cancer Spheroid Cultures. ADDT, 2015, 13, 402-414
- Hou S, Tiriac H, Sridharan BP, et al. Advanced Development of Primary Pancreatic Organoid Tumor Models for High- Throughput Phenotypic Drug Screening. SLAS Discovery, 2018, 23, 574-584.
- Hamilton, E. How Close Are We to End-to-End Automated Drug Discovery? The Science Times. May 19, 2020 https:// www.sciencetimes.com/articles/25060/20200319/close-endautomated- drug-discovery.htm (accessed July 20, 2020)