
Application Note
Optimizing GFP transfection with the SpectraMax i3 Multi-Mode Detection Platform
- Identify transfected vs. nontransfected cells easily
- Obtain quantitative data on relative transfection efficiencies accurately
- Measure cell confluence prior to transfection
- Faster time to results for reporter assays with SoftMax Pro Software
Introduction
Expression of fluorescent proteins, for example, green fluorescent proteins (GFP), is often used as a read-out for reporter gene assays. In a typical reporter assay, the regulatory sequence of a gene of interest is attached to a reporter gene that can be easily detected and measured. With a GFP reporter, increased activity of the gene of interest leads to increased expression of fluorescent protein in the cell, which can be measured on a fluorescence microplate reader or imaging cytometer.
The first step in performing reporter assays is transfection, the introduction of DNA into a eukaryotic cell. For best results, transfection must first be optimized by testing different transfection conditions. This may involve trying different transfection reagents, as well as different amounts of DNA and different ratios of DNA to transfection reagent. Cell density is also important, so it may be beneficial to test transfection at several different cell densities. Relative effectiveness of different transfection conditions can be monitored on a fluorescence microplate reader or imaging cytometer.
This application note demonstrates how the SpectraMax® i3 Multi-Mode Detection Platform and SpectraMax MiniMax™300 Imaging Cytometer are used to monitor transfection efficiency and speed the time to results for assays where transfection is key to success.
Methods
The day before transfection, cells were seeded at 15000, 10000, and 5000 cells per well in a 96-well black-wall, clearbottom plate. The next day, just prior to transfection, the cells were imaged on the SpectraMax MiniMax 300 Cytometer using the transmitted light (TL) channel, and percent confluence was calculated for each seeding density using SoftMax® Pro Software and StainFree™ Cell Detection Technology.
Cells were transfected in triplicate wells at each cell density. Four different transfection conditions were tested to determine optimal amounts of DNA and transfection reagent (Table 1).
Table 1. Transfection conditions. Four different transfection conditions were tested on each cell density. Two different amounts of DNA and four different volumes of transfection reagent were evaluated.
After gently pipetting up and down to mix, complexes were incubated at room temperature for 10-15 minutes. Meanwhile, the culture medium on the cells in the 96- well plate was replaced with 100 µL/well of fresh medium. The appropriate volume of transfection complex was added drop-wise to each well (Table 2). Cells were then returned to the incubator.
Table 2. Transfection setup. Transfection complexes were formed by combining Opti-MEM medium, DNA, and transfection reagent in bulk reactions. Enough complex was prepared to transfect ten wells for each test condition.
At 16 hours post transfection, total fluorescence intensity was measured on the plate reader, and the percentage of transfected cells was determined using the imaging cytometer. Cells were imaged using both the TL and green fluorescence channels. Using SoftMax Pro Software, cells in the TL images were identified with the StainFree analysis algorithm, and these were further classified as positive (GFP-expressing) or negative via the Classification feature in the software.
Results
Immediately prior to transfection, cells were imaged and percent confluence was calculated at each cell density using StainFree analysis (Figure 1).
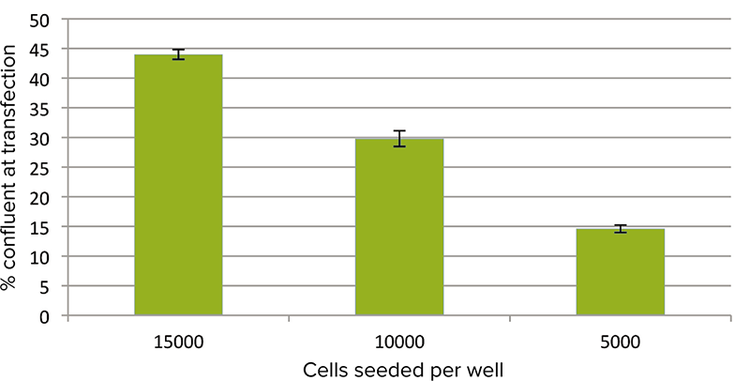
Figure 1. Cell confluence. Percent confluence of cells just prior to transfection was determined using the imaging cytometer. For initial seeding densities of 15000, 10000, and 5000 cells per well, the measured percent confluence was 44, 30, and 15, respectively.
At 16 and 21 hours post transfection, the cells were imaged using the TL and green fluorescence channels of the SpectraMax MiniMax 300 Imaging Cytometer (Figure 2). StainFree analysis was used to identify individual cells in each well, and cells were further classified as GFP-positive or GFPnegative using the classification feature in SoftMax Pro Software. To classify cells as positive or negative, a small number of cells on representative images were defined as positive or negative using the classification tools in the software. An algorithm then applied this information to all images. The resulting parameters calculated by the software included percent positive, average object intensity, object count, object roundness, and several others.
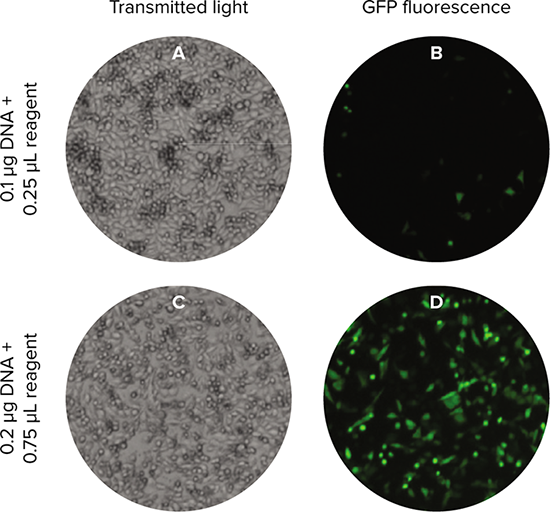
Figure 2. Imaging of transfected cells. Transfected cells were imaged using the TL (A, C) and green fluorescent (B, D) channels of the SpectraMax MiniMax 300 Imaging Cytometer. Cells shown were seeded at 15000 cells per well. Two transfection conditions are shown, representing low and high transfection efficiencies.
Of the four transfection conditions tested, 0.2 µg DNA and either 0.5 or 0.75 µL of transfection reagent were determined to yield the highest percentage of GFPexpressing cells (Figure 3A). These conditions also resulted in the highest average fluorescence intensity per cell (Figure 3B). GFP expression was higher at 21 hours post transfection than at 16 hours (16-hour data not shown).
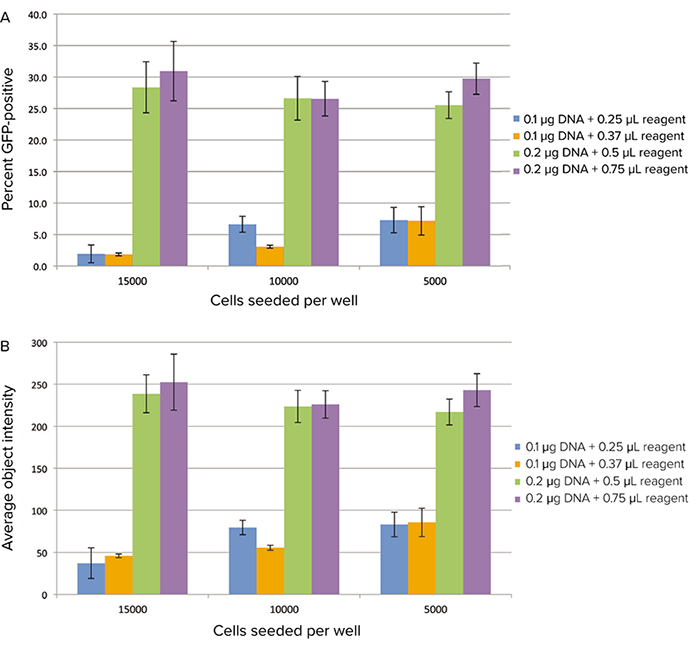
Figure 3. GFP expression imaged on the cytometer. Transfected cells were imaged on the SpectraMax MiniMax 300 Imaging Cytometer. A: percent GFP-positive cells calculated using the classification feature in the software. B: average cellular fluorescence intensity.
GFP expression could also be detected using the fluorescence plate reading mode of the SpectraMax i3 reader. Differing levels of fluorescence could be clearly discerned for the different transfection conditions (Figure 4). Total fluorescence of each well was detected, so for the most optimal transfection conditions, higher signal was detected in wells containing a higher density of cells. A more complete assessment is provided by the imaging cytometer, which can distinguish each cell and its relative level of fluorescence.
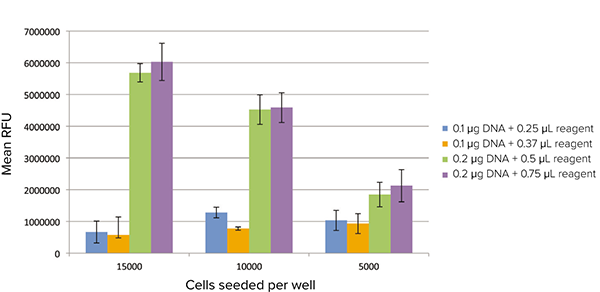
Figure 4. GFP expression detected on the plate reader. Transfected cells were read in fluorescence mode on the SpectraMax i3 Multi-Mode Microplate Reader. Mean background-subtracted RFU values are plotted for each transfection condition.
Conclusion
Transfection efficiency for a fluorescent reporter gene can be monitored in different ways. One way is to measure fluorescence with a microplate reader. This allows one to assess the overall fluorescence level in each test well, but it does not give the percent of cells transfected. A more informative way to assess transfection efficiency is to analyze the cells using an imaging cytometer, where the number of cells expressing detectable fluorescence can be compared to the total cell number. The imaging cytometer has the added benefit of enabling calculation of cell confluence prior to transfection, so that this information can be used as part of assay development.
The SpectraMax i3 Multi-Mode Microplate Reader and the SpectraMax MiniMax 300 Imaging Cytometer enable both ways of assessing transfection conditions for GFPbased reporter assays. The plate reader offers a fast, simple readout of average fluorescence per well, while the cytometer gives more detailed information, including total cell number and percent of cells expressing detectable GFP. SoftMax Pro Software simplifies the task of obtaining and analyzing all of this data. An efficient workflow for optimizing transfection means faster time to results for reporter assays.