
Application Note
Optimized settings for Transcreener FI Assays on SpectraMax iD3 and iD5 microplate readers
- Single-addition, mix-and-read assay format for high-throughput screening
- Z' factor > 0.7 at 10% conversion of 10 µM ATP
- Read a 384-well plate in three minutes or less
Introduction
Meera Kumar | BellBrook Labs
Joyce Itatani | Applications Scientist | Molecular Devices
Cathy Olsen | Sr. Applications Scientist | Molecular Devices
Transcreener® HTS is a universal, high-throughput, biochemical assay platform based on the detection of nucleotides, which are formed by thousands of cellular enzymes. Many of these enzymes catalyze the covalent regulatory reactions that are central to cell signaling and are of great value as targets in drug discovery.
The Transcreener® FI Assays are single-step, competitive immunoassays for direct detection of nucleotides with a red fluorescence intensity (FI) readout. The reagents for all of the assays are a red tracer bound to a highly-specific monoclonal antibody-quencher conjugate. Nucleotide diphosphate produced by the target enzyme displaces the tracer from the antibody-quencher conjugate, resulting in an increase in fluorescence intensity (Figure 1). The use of a red tracer minimizes interference from fluorescent compounds and light scattering. The Transcreener FI Assays are designed specifically for HTS with a single-addition, mix-and-read format.
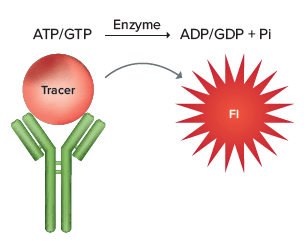
Figure 1. Transcreener® FI Assay principle.
Validation criteria
A critical factor in realizing the advantages of the Transcreener HTS assays is the correct setup of the microplate reader used for data readout. Proper selection of optical components and other settings can impact the instrument`s sensitivity for any given assay. The key instrument parameters for Transcreener HTS assay performance were identified by running a 10 μM ATP/ADP standard curve (24 replicates), as standard curves of this type mimic enzyme reactions. Starting with 10 μM ATP, ADP was added in increasing amounts and ATP was decreased proportionately, maintaining a total adenine nucleotide concentration of 10 μM. The integration time was varied to determine the requirements for a Z' > 0.5. Validation of an instrument for use with the Transcreener FI Assays requires a Z' > 0.7 at 10% conversion of 10 μM ATP.
Sample FI standard curve
As the ratio of ADP:ATP increases, the proportion of bound tracer vs. free tracer decreases, resulting in an overall increase in RFU values. Assay plates with a 15-point standard curve, consisting of ADP:ATP ratios representing conversion rates ranging from 1% to 100%, were read on a SpectraMax® iD5 Multi-Mode Microplate Reader.
Materials
- Transcreener ® ADP 2 FI (3013)
- Transcreener ® GDP FI (3014)
- ATP/ADP Mixture: 10 mM MgCl2, 20 mM HEPES, pH 7.5, 0.01% Brij-35, and ATP/ADP (combined to a constant adenine concentration of 10 μM)
- ADP Detection Mixture: 1X Stop & Detect Buffer B, 8 nM ADP Alexa594 Tracer, and 10 μg/mL ADP 2 Antibody-IRDye ® QC-1
- Free Tracer – 1X Stop & Detect Buffer B and 8 nM ADP Alexa594 Tracer
- Buffer Blank – 1X Stop & Detect Buffer B and 10 μg/mL ADP 2 Antibody-IRDye ® QC-1
Methods
- Dispense 10 μL of each ATP/ADP combination across an entire row of a 384-well plate.
- Add 10 μL of ADP Detection Mix to those rows.
- Dispense 10 μL of the 10 μM ATP/0 μM ADP combination into row P.
- Dispense 10 μL of Free Tracer into wells P1-P12.
- Dispense 10 μL of Buffer Blank into wells P13-P24.

Figure 2. A) Z' values observed in a standard curve mimic conversion of 10 μM ATP to ADP. B) Zoomed view of the 0–2 μM ADP section of the standard curve shows the Z' validation minimal qualification data (red dotted line) and 10% ATP conversion validation point (black dotted line). Green plots show data from SpectraMax iD5 reader using monochromators and 200 ms (triangles) or 50 ms (circles) integration time. Blue plot shows data obtained using filters and 50 ms integration time.
For a more detailed procedure on how to prepare a standard curve, please refer to the appropriate Transcreener® Technical Manual (https://www.bellbrooklabs.com/technical-resources/technical-manuals/).
Microplate readers
- SpectraMax iD3 Multi-Mode Microplate Reader
- SpectraMax iD5 Multi-Mode Microplate Reader
Optional, for SpectraMax iD5 reader:- Fluorescence Filter with holder 565nm BW 30nm (Molecular Devices cat. #6590-0131)
- Fluorescence Filter with holder 625nm BW 35nm (Molecular Devices cat. #6590-0108)
Fluorescence detection using the SpectraMax iD5 reader’s monochromators for wavelength selection was compared to that using a filter pair specific for the Alexa594 tracer. The SpectraMax iD3 reader detects fluorescence using monochromators only.
Instrument setup
The SpectraMax iD3/iD5 readers use SoftMax® Pro Data Acquisition & Analysis Software. Proceed with the following steps to read a plate using optimized settings:
- Open the SoftMax Pro Software and select Fluorescence for the Read Mode and Endpoint for the Read Type.
- Enter 575 for excitation, and 620 for emission in Wavelengths. If using filters (available on the SpectraMax iD5 reader only), install the 565/30 excitation filter and 625/35 emission filter, and then select these filters from the Excitation and Emission dropdown menus.
- Plate Type and Read Area should be selected based on the microplate used and wells to be read. For the standard curve described, all wells of the microplate are read.
- Set PMT Gain to Automatic, and read from the top (do not check the Read from Bottom box).
- Set integration time to 50-200 ms if using monochromators (increasing the integration time improves the Z’ factor at 10% conversion) on either reader, or 50 ms if using filters on the SpectraMax iD5 reader.
- Microplate and read height should always be optimized when initially setting up an assay.
The same instrument settings can be used to read subsequent plates as long as the volumes, microplate lot, tracer, and concentrations remain the same. Table 1 summarizes the settings described above.
Excitation: 575 nm
Emission: 620 nm
Select ‘Use Filter’ for both Ex, Em.
Excitation: 565 nm
Emission: 625 nm
PMT gain: Automatic
Integration time: 50–200 ms
Read from top
Read height: 5.97 mm
PMT Gain: Automatic
Integration Time: 50 ms
Read from top
Read height: 5.97 mm
Table 1. Recommended SpectraMax iD3/iD5 reader settings. Microplate and read height should be optimized for each new lot of microplates or assay volume used (use the Show Pre-Read Optimization Options in the instrument settings in SoftMax Pro Software. If filters are used with the SpectraMax iD5 reader, integration time may be set to 50 ms, reducing the time required to read a plate.
Table 2. Assay performance with different reader settings.
Conclusion
We demonstrate the validation of SpectraMax iD3 and iD5 readers for use with the Transcreener FI Assays. By using the optimized instrument settings suggested within this application note, Z' values > 0.7 are achievable.