
Application Note
Measure p53-MDM2 protein interaction with NanoBRET technology
- Improve sensitivity over other BRET techniques with brighter NanoLuc signal and greater spectral separation
- Detect protein interactions at physiological levels in live cells with high sensitivity
- Calculate NanoBRET ratios and graph results automatically with SoftMax Pro Software
Introduction
Joyce Itatani | Applications Scientist | Molecular Devices
Cathy Olsen, PhD | Sr. Applications Scientist | Molecular Devices
BRET (bioluminescence resonance energy transfer) is a technique for measuring protein-protein or protein-ligand interactions that involves the interaction of a bioluminescent donor and a fluorescent acceptor. When donor and acceptor are closer than 10 nm to each other, the donor excites the acceptor, which then emits fluorescence. By tagging one protein of interest with the donor and its binding partner with the acceptor, one can measure protein interactions by using a microplate reader to detect light emitted by the donor and acceptor.
NanoBRET™ technology from Promega improves upon earlier generations of BRET, including BRET1 and BRET2, by incorporating a brighter luminescence donor (NanoLuc luciferase), optimized energy acceptor (HaloTag®-NCT), and a wider separation between donor and acceptor wavelengths (Figure 1). These improvements offer increased signal, better sensitivity, and lower background, enabling detection of protein interactions within the context of living cells1.
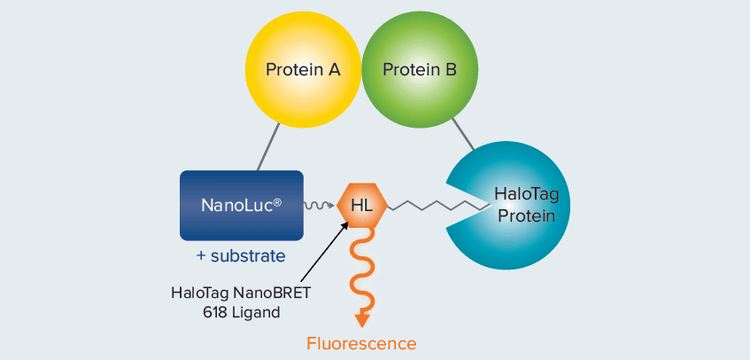
Figure 1. NanoBRET assay. When a NanoLuc-Protein A fusion (energy donor) interacts with a fluorescently labeled HaloTag-Protein B fusion (energy acceptor), donor and acceptor are brought close together and energy is transferred.
Detection of NanoBRET signals, and analysis of the resulting data, requires sensitive instrumentation and advanced software. The SpectraMax® iD5 Multi-Mode Microplate Reader with SoftMax® Pro Software lets researchers acquire NanoBRET data using an optimized filter set, and apply analysis including curve fitting to the results. Here, we describe validation of the microplate reader with the NanoBRET™ PPI Control Pair, consisting of the interacting protein partners p53 and MDM2, on the SpectraMax iD5 reader. The p53 pathway activator nutlin-3 was used to disrupt the p53-MDM2 interaction in a concentration-dependent manner, and the results were analyzed and graphed using SoftMax Pro Software.
Materials
- NanoBRET PPI Control Pair (p53, MDM2; Promega cat. #N1641)
- NanoBRET Nano-Glo ® Detection System (Promega cat. #N1661)
- ViaFect ™ Transfection Reagent (Promega cat. #E4981)
- Nutlin-3 (Millipore-Sigma cat. #6287)
- Opti-MEM ™ Reduced Serum Medium, no phenol red (ThermoFisher cat. #11058021)
- 293 (HEK-293) cells (ATCC cat. #CRL-1573)
- Eagle’s Minimum Essential Medium (EMEM, Corning cat. #10-010-CV)
- BenchMark ™ Fetal Bovine Serum (Gemini Bio-Products cat. #100-106)
- Penicillin-streptomycin (10,000 U/mL, ThermoFisher cat. #15140122)
- 6-well clear microplate (VWR cat. #1006-892)
- 96-well white, flat bottom polystyrene microplate (Corning cat. #3917)
- SpectraMax iD5 Multi-Mode Microplate Reader (Molecular Devices cat. #iD5-STD), equipped with the following:
- Donor filter: 447 nm BW 60 nm (Molecular Devices cat. #6590-0088)
- Acceptor filter: 610 nm LP (Molecular Devices cat. #6590-0117)
Methods
HEK-293 cells were suspended in cell culture medium (EMEM + 10% fetal bovine serum + 1% penicillin/ streptomycin) at 400,000 cells per mL and plated into a 6-well plate at 2 mL per well, or 800,000 cells per well. Cells were allowed to attach to the wells for 4 to 6 hours at 37°C, 5% CO2. They were then transfected with 2 μg p53-HaloTag Fusion Vector DNA and 0.2 μg NanoLuc-MDM2 Fusion Vector DNA in 100 μL Opti-MEM Reduced-Serum Medium, without phenol red, and a 3:1 ViaFect Transfection Reagent:DNA ratio. Cells were incubated overnight for 20 to 24 hours at 37°C, 5% CO2.
HEK-293 cells were harvested by spinning down at 1,000 rpm for five minutes, and the culture medium was discarded. Cell density was adjusted to 2.2 x 10⁵ cells per mL in Opti-MEM + 4% FBS and divided into two 15-mL conical tubes. One tube was treated with 0.1 μM HaloTag 618 Ligand, and the other was treated without ligand. The cells were plated into a 96-well white microplate at 2 x 10⁴ cells per well and immediately treated with either a 1:3 serial dilution of nutlin-3 (n = 4 replicates per concentration) or 0.5% DMSO. The cells were incubated overnight at 37°C, 5% CO2.
A 5X solution of NanoBRET Nano-Glo substrate was made in Opti-MEM + 4% FBS, and 25 μL were added to each well. Donor emission (447 nm) and acceptor emission (610 nm) were measured on the SpectraMax iD5 reader using the settings shown in Table 1. NanoBRET ratios were calculated in SoftMax Pro Software by dividing acceptor signal by donor signal, and ratios were multiplied by 1000 to obtain whole-number milliBRET units (mBU). The mBU values were background corrected by subtracting mean mBU for samples containing no ligand. Results for nutlin-3-treated cells were analyzed and graphed using a 4-parameter curve fit in SoftMax Pro Software (version 7.0.3 and higher). Z’ factors were calculated at each concentration of nutlin-3 to assess assay performance.

Specify wavelengths

Use filter [make sure filters are installed]
Lm1: 447 nm
Lm2: 610 nm
Integration time: 1000 ms
Read height: 0.67 mm*
*Read height should be optimized for the microplate used. Table 1. NanoBRET detection settings for the SpectraMax iD5 reader.
Results
NanoBRET ratio (mBU) vs. nutlin-3 concentration was graphed using a 4-parameter curve fit in SoftMax Pro Software (Figure 2). The calculated IC50 value for nutlin-3 was 1.2 μM, consistent with results shown by Promega for the NanoBRET PPI Control Pair2.
Z’ factors of at least 0.7 were obtained at all concentrations of nutlin-3 used to generate the curve shown in Figure 2. For concentrations of 0.07 μM and lower, Z’ factors were equal to 0.9. These values demonstrate the robustness and low variability of this NanoBRET assay.
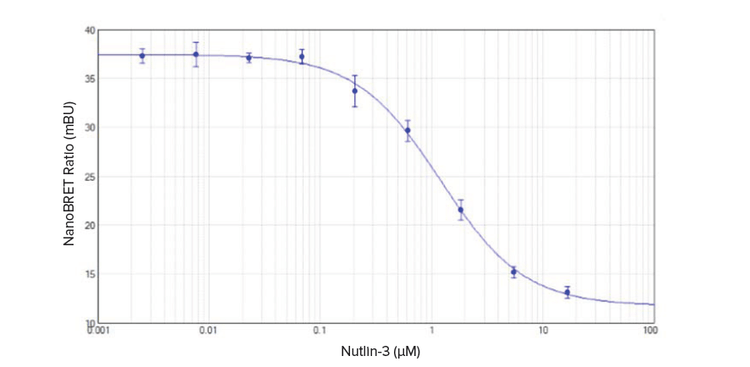
Figure 2. Disruption of p53-MDM2 interaction by nutlin-3. The 4-parameter curve fit generated in SoftMax Pro Software had an IC50 of 1.2 μM (n = 4).
Conclusion
The SpectraMax iD5 reader, equipped with optimal filters for detection of NanoBRET donor and acceptor signal, was validated for use with this assay using the NanoBRET PPI Control Pair (p53, MDM2). Nutlin-3 was used to disrupt p53-MDM2 interaction in a concentration-dependent manner, yielding an expected IC50 value of 1.2 μM. Z’ factors calculated to assess assay performance and variability in replicates were between 0.7 and 1 for all sample concentrations tested, confirming the sensitivity of the SpectraMax iD5 reader and the robust nature of the NanoBRET assay. SoftMax Pro Software was configured to calculate NanoBRET ratios and graph the data automatically, streamlining analysis.
References
- Machleidt T, Woodroofe CC, Schwinn MK, Mendez J, Robers MB, Zimmerman K, Otto P, Daniels DL, Kirkland TA, and Wood KV. NanoBRET—A Novel BRET Platform for the Analysis of Protein-Protein Interactions. ACS Chem. Biol. 2015, 10, 1797–1804.
- Technical Manual: NanoBRET Protein: Protein Interaction System. Promega Corporation.
Introduction
Joyce Itatani | Applications Scientist | Molecular Devices
Cathy Olsen, PhD | Sr. Applications Scientist | Molecular Devices
BRET ( 生物发光共振能量转移 ) 是一种测 量蛋白 - 蛋白或蛋白 - 配体相互作用的技 术,涉及生物发光供体和荧光受体的相互 作用。当供体和受体彼此相距小于 10 nm 时,供体激发受体,然后受体发射荧光。 通过用供体标记一种目的蛋白,用受体标 记该目的蛋白的结合配体,可以使用酶标 仪来检测供体和受体发射的光,从而测量 蛋白质相互作用。
Promega 的 NanoBRET™ 技术通过使用更 亮的发光供体 ( NanoLuc 荧光素酶 )、优化 的能量受体 (HaloTag®-NCT) 以及供体和受 体波长之间更宽的分离,改进了早期的 BRET,包括 BRET1 和 BRET2 ( 见图一 ) 不 足。这些改进提供了更强的信号,更好的 灵敏度和更低的背景,使得在活细胞内检 测蛋白质相互作用成为可能。
图 1 NanoBRET 图示。 当 NanoLuc- 蛋白 A 融合体 ( 能量供体 ) 与荧光标记的 HaloTag蛋白 B 融合体 ( 能量受体 ) 相互作用时,供体和受体会距离更近,能量发生转移
检测 NanoBRET 信号并分析结果数据需要 灵敏的仪器和功能强大的分析软件。标配 SoftMax®Pro 软件的 SpectraMax®iD5 多功 能酶标仪可让研究人员使用优化的滤光片 组系统获得 NanoBRET 数据结果,并对结 果进行包括曲线拟合在内的分析。在这 里,我们描述了在 SpectraMax iD5 酶标 仪上使用 NanoBRET™ PPI 质控对来验证 酶标仪功能,该质控对由相互作用的蛋白 质配偶体 p53 和 MDM2 组成。使用 p53 途 径激活剂 nutlin-3 以浓度依赖性方式破坏 p53 与 MDM2 的相互作用,并使用 SoftMax Pro 软件分析和绘制结果。
材料
- NanoBRET PPI 质控对 (p53, MDM2; Promega cat. #N1641)
- NanoBRET Nano-Glo® 检测体系 (Promega cat. #N1661)
- ViaFect™ 转染试剂 (Promega cat. #E4981)
- Nutlin-3 (Millipore-Sigma cat. #6287)
- Opti-MEM™ 36/5000 减少量的血清培养 基,无酚红 (ThermoFisher cat. #11058021)
- 293 (HEK-293) 细胞 (ATCC cat. #CRL-1573)
- Eagle's 最低限度基础培养基 (EMEM, Corning cat. #10-010-CV)
- BenchMark™ 胎牛血清 (Gemini Bio-Products cat. #100-106)
- 青霉素-链霉素 (10,000 U/mL, ThermoFisher cat. #15140122)
- 6 孔透明微孔板 (VWR cat. #1006-892)
- 96 孔白色平底聚苯乙烯微孔板 (Corning cat. #3917)
- SpectraMax iD5 多功能酶标仪(Molecular Devices cat. #iD5-STD), 包括以下配 置:
- 供体滤光片: 447 nm BW 60 nm (Molecular Devices cat. #6590-0088)
- 受体滤光片: 610 nm LP (Molecular Devices cat. #6590-0117)
方法
将 HEK-293 细胞以 400,000 个细胞/mL 悬 浮于细胞培养基 ( EMEM + 10% 胎牛血清 + 1% 青霉素/链霉素 ) 中,并接种到 6 孔板 上,每孔 2 mL,或每孔 800,000 个细胞。 使细胞在 37℃,5% CO2 下与孔接触 4-6 小时。然后用 100 μL Opti-MEM 减少量的血 清培养基,无酚红,含 2 μg p53-HaloTag 融合载体 DNA 和 0.2 μg NanoLuc-MDM2 融合载体 DNA,和 3:1 ViaFect 转染试剂: DNA 比例,来转染细胞。细胞在 37℃, 5% CO2 下孵育过夜 20-24 小时。
通过以 1,000 rpm 旋转 5 分钟收获 HEK-293 细胞,弃去培养基。在 Opti-MEM + 4% FBS 中将细胞密度调节至2.2×10⁵ 个细胞/ mL,并分装在两个 15 mL 锥形 管。一管用 0.1 μM HaloTag 618 配体处 理,另一管无配体处理。将细胞以每孔 2×10⁴ 个细胞接种到 96 孔白色微孔板 中,并立即用 1:3 连续稀释的 nutlin-3 ( 每 个浓度 n = 4 个重复 ) 或 0.5% DMSO 处 理。将细胞在 37℃,5% CO2 下孵育过 夜。
在 Opti-MEM + 4% FBS 中制备 5x NanoBRET Nano-Glo 底物溶液,并向每个孔中 加入 25 μL。使用表 1 中所示的设置在 SpectraMax iD5 酶标仪上测量供体发射光 (447 nm) 和受体发射光 (610 nm)。通过 将受体信号除以供体信号在 SoftMax Pro 软件中计算 NanoBRET 比率,并将比率乘 以 1000 以获得整数 milliBRET 单位 (mBU)。通过减去不含配体的样品的平均 mBU 来对 mBU 值进行背景校正。 分析了 nutlin-3 处理的细胞的结果,并使用 SoftMax Pro 软件 ( 版本 7.0.3 和更高版 本 )中的 4 参数曲线拟合图表。在每种浓 度的 nutlin-3 下计算 Z' 因子以评估测定性 能。
Specify wavelengths
Use filter [make sure filters are installed]
Lm1: 447 nm
Lm2: 610 nm
Integration time: 1000 ms
Read height: 0.67 mm*
*Read height should be optimized for the microplate used. 表 1 SpectraMax iD5 酶标仪上的 NanoBRET 检测设置
结果
使用 SoftMax Pro 软件中的 4 参数曲线拟 合,绘制 NanoBRET 比率 (mBU) 对 nutlin-3 浓度的曲线 ( 图 2 )。计算出的 nutlin-3 的 IC50 值为 1.2 μM,与 Promega 对 NanoBRET PPI 质控对所示的结果一 致。
在用于产生图 2 所示曲线的所有浓度的 nutlin-3 下获得至少 0.7 μM 的 Z' 因子。对 于 0.07 μM 和更低的浓度,Z' 因子等于 0.9 μM。 这些值证明了这种 NanoBRET 分 析的稳定性和低变异性。
图 2 nutlin-3 对 p53-MDM2 相互作用的破坏 SoftMax Pro 软件中生成的 4 参数曲线拟合的 IC50 为 1.2 μM (n = 4)。
总结
SpectraMax iD5 酶标仪配备了用于检测 NanoBRET 供体和受体信号的极佳滤光 片,被证明了可以使用 NanoBRET PPI 对 质控对 (p53,MDM2) 进行测定。Nutlin-3 用于以浓度依赖性方式破坏 p53-MDM2 相 互作用,产生 1.2 μM 的预期 IC50 值。对于 所有测试样品浓度,计算以评估测定性能 和重复性变异性的 Z' 因子在 0.7 和 1 之 间,证实了 SpectraMax iD5 酶标仪的灵 敏度和 NanoBRET 实验的稳定性质。 SoftMax Pro 软件可计算 NanoBRET 比率 并自动绘制数据,简化分析。
参考内容
- Machleidt T, Woodroofe CC, Schwinn MK, Mendez J, Robers MB, Zimmerman K, Otto P, Daniels DL, Kirkland TA, and Wood KV. NanoBRET—A Novel BRET Platform for the Analysis of Protein-Protein Interactions. ACS Chem. Biol. 2015, 10, 1797–1804.
- Technical Manual: NanoBRET Protein: Protein Interaction System. Promega Corporation.