
Application Note
The diverse utility of CloneSelect Imager in label-free imaging applications
- High speed acquisition to meet the demands of high-throughput applications
- Easy-to-use software ideal for multi-person group with no prior microscopy training
- Preconfigured algorithms for colony counting, confluence measurements, and tools for monoclonality assessment and reporting
- Compatible with a variety of plate formats from omni-trays to 384-well microplates
Introduction
Sarmad Al-Bassam, PhD | Applications Scientist | Molecular Devices
Advances in objectives, cameras and software have allowed microscopes to automate common and routine tasks, applying to discovery and manufacturing groups within the life sciences. However, setting up an acquisition on an automated microscope can be a difficult task that requires a significant investment in time, effort, and specialized training upfront. Variability in acquisition times may also be an issue contributing to the productivity and throughput needs of a research or development group. There is also the challenge of optimizing the image exposure and focal plane to ensure that high-quality data is captured for downstream analysis.
Quantifying biology in a label-free microplate format is also not without challenges. For one, label-free images have low contrast between signal and background, which makes analysis difficult. Another common issue has to do with analysis of a large field-of-view biology that requires a number of tiled images. Finally, linking well images and metadata from various timepoints acquired discontinuously can be challenging.
The CloneSelect™ Imager is an automated imager that can perform imaging for a variety of transmitted white light applications. Its ease of use is ideal for a multi-person group with no prior microscopy training. Its rapid acquisition is also ideal for meeting throughput needs of a large group. It has a unique vacuum-based design that ensures images are in focus on a variety of plate types for rapid imaging of a plate in \~ 90 seconds. It’s also well suited to deal with biological questions that involve whole-well and Devicesmulti-timepoint analyses. Here, we discuss a variety of common label-free imaging applications and the utility of the system on a multitude of microplate formats.
Results
Colony counting in 6-well plates
A common label-free application is counting objects (e.g. colonies) in whole-wells of a microplate. One typical example includes the clonogenic assay (also known as the colony formation assay), an in vitro cell survival assay based on the ability of a single cell to grow into a colony in semi-solid gelatinous media. Another common application involves characterization of colony growth rates in semi-solid media for screening type of work. Downstream screening work may look for high secreting or high-binding targets from a heterogenous population. In these applications, 6-well plates are the commonly used format because they offer a balance between throughput and well area. In these applications, it is of paramount importance to be able to image entire wells of a plate rapidly and perform objective analysis on the resultant data. Such analysis includes the ability to quantify parameters like colony number and size and be able to export the raw data and metadata for further analysis.
The CloneSelect Imager allows imaging of a 6-well plate for colony visualization and characterization. In one example, a 6-well plate containing SJK-285 mouse hybridoma cells is scanned at day 7 (Figure 1). A plate view showing the contents of each well is displayed on the Plate Thumbnails tab (Figure 1B). Note that in this view, the algorithm that detects the presence of colonies is shown in green, whereas the background is rendered black. Clicking on each thumbnail takes you to the whole-well view image, which contains a matrix of 10 by 10 tiles of 4X images aligned with one another and evaluated by the software as one well (Figure 1C).
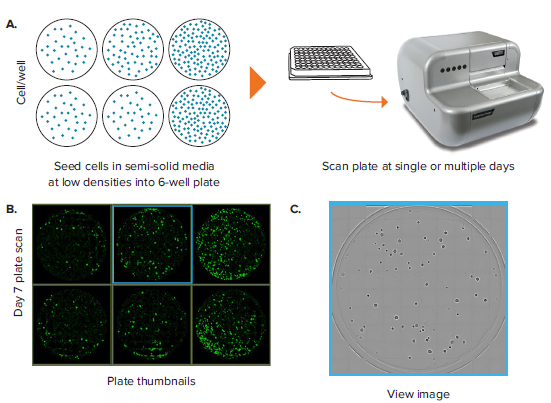
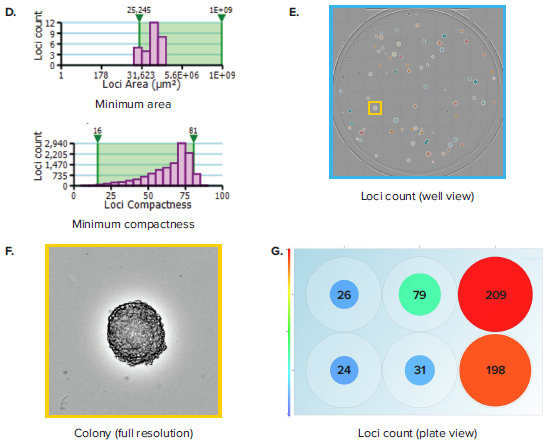
Figure 1. Colony counting in 6-well plates. (A) A 6-well plate, which contains hybridoma cells seeded at 50, 100 and 200 cells per well and allowed to grow for 7 days, is imaged. (B) Plate Thumbnail view shows whole plate in which colonies are identified by green pseudo-coloring on a black background. (C) View Image window shows transmitted white-light image of a whole well. (D) Segmentation and colony counting can be adjusted by changing the gating range for colony area and colony compactness, a measure of circularity. (E) Colony segmentation in whole-well view based on optimized gating of area and compactness. (F) Full resolution view of colony obtained from zooming in inside the well view. (G) Plate view showing colony count in size-based colored circles, wherein large red circles show a well with a high colony number and small blue circles show a well with a low colony number.
Whereas rapid acquisition allows the plate to be scanned in \~ 90 seconds, the on-the-fly analysis allows for efficient and objective quantification of the images. Navigating to the Loci Count tab allows you to gate the objects within the well based on size (area) and compactness (also known as circularity, Figure 1D). The user can manipulate the gating thresholds for those 2 parameters in order to arrive at a level that properly segments colony loci in all wells (Figure 1E). This can be confirmed by toggling between wells and checking the effectiveness of segmentation across wells. Finally, a return to the plate view inside the Loci Count tab allows you to visually inspect the colony number. A data export button allows for pertinent data for each plate to be exported. Exports support multiple formats, including CSV, XML and Excel. Table 1 shows a typical export that includes loci count and mean loci area for each well. Multiple scans at different time points can yield data on loci size at different days. This data can be aggregated to get a readout of mean colony size at different timepoints.
Mean loci area (μm
2
)
Table 1. Exported data from the plate shown in Figure 1 showing colony (loci) count and mean loci area per well.
Monoclonality assessment in 96-well and 384-well plates
In addition to colony counting, a common label-free application is monoclonality assessment and clonal outgrowth characterization. In this application, a limiting dilution of a given cell population is set up such that only a subset of wells within a given plate are seeded with single cells. 96-well and 384-well plates are commonly used in this application because it balances the need for high throughput with the limitation in single-cell seeding efficiency that comes from using a 1536-well plate. Limiting dilutions allow single cells to cluster based on a Poisson distribution, allowing for isolation of single cell-derived clones later on.
The CloneSelect Imager allows for rapid data generation for monoclonality-related applications. A plate scan of a 96-well or 384-well plate can be acquired easily and rapidly in \~ 90 seconds at standard resolution of 3.7 μm/pixel. Following acquisition, accessing the Plate Thumbnails tab allows the user to navigate from the plate level (Figure 2B, 2D). From this interface, users can click on single colony-containing wells (Figure 2C, 2E). If the user wishes to determine whether a specified colony originated from a single cell, they can do so by accessing the Report Generator tab. In this tab, various scans acquired over a number of different days are linked. This allows the user to view the well from the single colony timepoint then navigate back to the initial day when single cells were seeded. A Cell Region (yellow box, Figure 2C, E) can be designated and adjusted for each subsequent timepoint, allowing for automated monoclonality report generation for a specified well. Figure 2F shows an example of Cell Region from a number of different timepoints that is commonly included in those exports.
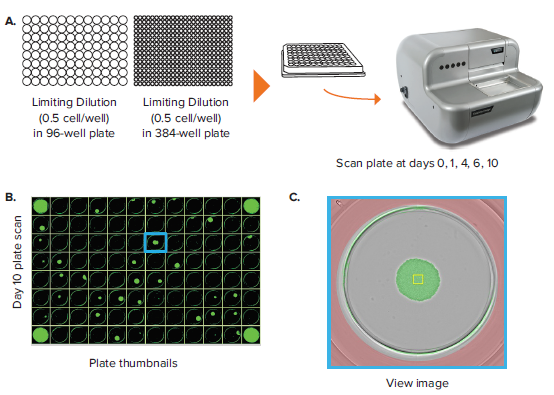
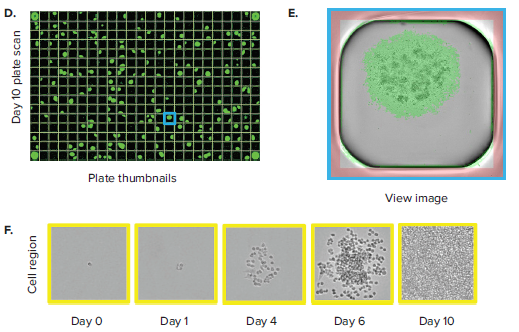
Figure 2. Monoclonality in 96-well and 384-well plates. (A) Cells are seeded into either 96- or 384-well plates at a density of 0.5 cell/well. The plates are scanned by CloneSelect Imager at different timepoints starting from day 0. (B) Plate Thumbnails view of 96-well plate 10 days after limiting dilution. (C) Whole-well image from a 96-well plate. Yellow box corresponds to cell region. (D) Plate Thumbnails view of 384-well plate 10 days after limiting dilution. (E) Whole-well image from a 384-well plate. (F) The Report Generator automatically generates filmstrips of user defined cell regions, showing the cell image in panel C chronologically from days 0 to day 10.
Measuring confluence in 96-well half-area plates
Another important label-free application is the assessment of well confluence. Confluence may be an end-point process, whereby a static timepoint scan is acquired at the end of an experiment. 96-well plate formats are commonly used, but more often researchers are opting for 96-well half-area plates because it increases throughput while also saving media and reagent costs. In an example experiment, a 96-well half area plate is used to set up a serial dilution of a cell population starting from 10,000 cells/well in the top row and diluted 2-fold subsequently in rows B through H (Figure 3A). Figure 3B shows the Plate Thumbnails tab view. The software allows selecting from 3 thresholding algorithms based on the cell type or morphology. Applying the appropriate preconfigured thresholding algorithm allows on-the-fly calculation of percent confluence. Navigating to the Confluence tab allows you to visualize the plate-level confluence data in pie-chart form, whereby a complete pie represents 100% confluence in the specified well (Figure 3C). From the confluence data, it is also possible to extrapolate the cell number per well (Figure 3D). Cell number estimation requires establishing a standard curve based on known seeding densities for a particular cell type.
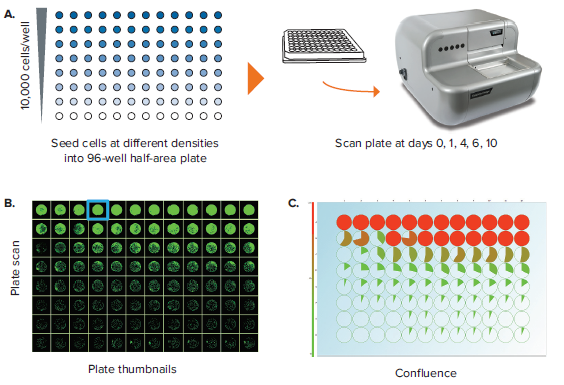
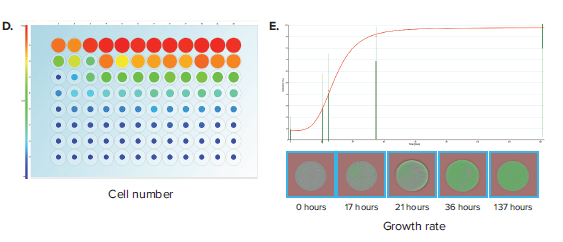
Figure 3. Confluence assessment in 96-well half area plates. (A) Cells are seeded into 96-well half-area plates at decreasing densities starting from 10,000 cells/well. The plates are scanned by CloneSelect Imager at different timepoints starting from the initial seeding. (B) Plate Thumbnails view shows confluence pattern, whereby green pseudo-coloring displays the presence of cells and black displays background. (C) Confluence tab view shows the quantification of confluence displayed in Pie-chart format. (D) Cell Number tab shows a visualization of estimated cell number based on a predetermined standard curve. (E) Growth Rate view shows a well-specific view whereby percent confluence is plotted with respect to time. Red curve shows the mean values for all wells. A well image film strip shows the well confluence image at different timepoints.
Alternatively, confluence is commonly applied as a kinetic process, whereby multiple timepoint scans are acquired and the data is plotted to generate a growth curve. In this application, confluence is critical to characterizing the growth characteristics of a cell population and plays an important role in cell line development. Examples include characterizing growth from single-cell wells (from either limiting dilution or single-cell printing) to exclude low-growing clones and characterizing post colony-picking growth rates of a population of cells. Navigating to the Growth Rate tab allows linking of various acquisition timepoints (Figure 3E). Researchers can compare how a particular well’s growth rate compares to others within a plate. Data for confluence and cell number for various timepoints may be exported to a common format for further analysis.
Conclusion
Label-free imaging is the most direct and non-invasive method to assess a biological sample in a microplate. For some assays, label-free imaging allows the non-invasive observation of cell growth in a microplate, allowing a researcher to run an experiment to its logical endpoint. In comparison, colorimetric or fluorescence imaging assays require samples to be fixed and stained for markers, in effect causing an experiment to be terminated at the point of observation. Among other applications, label-free imaging is highly applicable in biologics production environments such as cell line development programs.
The CloneSelect Imager is ideal for rapid label-free imaging at a fixed focal height on a number of validated plate formats. We demonstrated a number of different applications with a diverse set of plate formats, including 6-well plates, 96-well standard and half-area plates, and 384-well plates. It is also possible to image additional plate formats, including omni trays, round bottom plates, 12-, 24-, and 48-well plates. The system can image an entire plate in \~ 90 seconds and uses on-the-fly image analysis to glean objective insights from image-based data. Predetermined algorithms for cell and object segmentation allow precise and accurate measurements for a suite of biological applications. Objective analysis of label-free data allow consistent and informed decisions for future experiments.