
Application Note
Confident assurance of clonality using calcein AM with minimal effect on viability
- Easily detect single cells with automated image analysis
- Automated monoclonality identification on Day 0
- Assure monoclonality with use of Calcein AM viability dye
- Maintain high viability of clonal outgrowth
Sarmad Al-Bassam, PhD | Applications Scientist | Molecular Devices
Abstract
Assessing clonality is key to the establishment of a cell line, and evidence of monoclonality is required by regulatory agencies to get a biopharmaceutical drug to the marketplace. The traditional and most accepted approach involves the visualization of microplate wells using transmitted white light (brightfield) on day 0 to confirm the presence of a single cell. However, the definitive identification of a single cell on the initial day of cell seeding is not without challenge, as cellular debris and well artifacts can be easily mistaken for cells. Here, we demonstrate an optimized workflow using the fluorescence reagent, calcein AM, in conjunction with a fluorescence-capable CSI that shows similar viability to label-free conditions while simultaneously providing high assurance of clonality. In this workflow, we determine a concentration of calcein AM that is ideal for detection of single cells on a fluorescence-capable CloneSelect™ Imager while minimizing cytotoxic effects on clonal outgrowth. We describe guidelines for establishing an optimal concentration of viability dye for different cell types.
Introduction
The development of cell lines that express a specific protein of interest is critical to the generation of biologics, and regulatory agencies require evidence of monoclonality in order to get a biologic to the marketplace. The traditional approach involves visualization of wells using transmitted white light on day 0 to confirm the presence of a single cell. However, this approach is not without challenge, as cellular debris and well artifacts can be easily mistaken for cells. Consequently, cell line developers typically evaluate cells at the colony state and trace back the origins of the colony to confirm monoclonality.
An alternative method involves fluorescence labeling of the cell population prior to seeding single cells. Here we use the viability dye calcein AM (CAM), a molecule that fluoresces green only after translocating the membrane of living cells, to more easily automate single cell detection while simultaneously establishing clonality more conclusively. We outline the differences between a transmitted white light (WL) workflow and one involving both WL and fluorescence (FL).
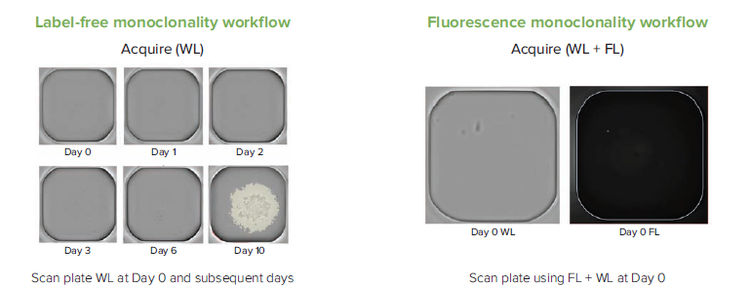
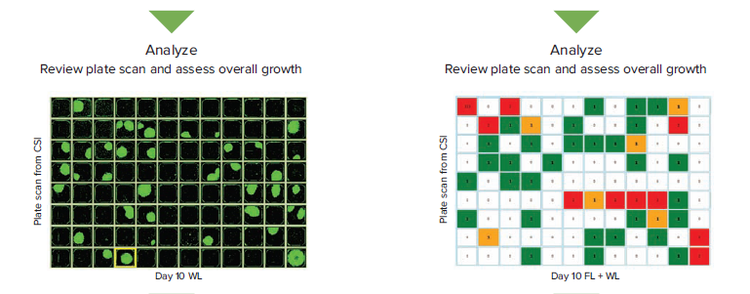
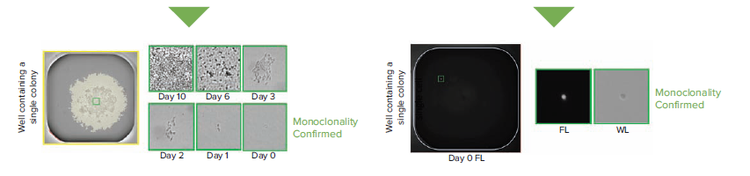
Figure 1. Comparing the transmitted white light (WL) and fluorescence (FL) workflows in assessing monoclonality
Results
Determining the optimal CAM concentration for single cell detection
A critical parameter in developing a reliable labeling protocol is ensuring cells are adequately labeled for detection. Three concentrations of CAM (0.5 μM, 1 μM, 5 μM) were compared under identical staining conditions. We observe that the majority of cells are detectible at 5 μM and 1 μM CAM, but not at 0.5 μM. Note that the concentrations depend on specific cell type and staining protocol, but a similar dilution series can be performed to determine optimal staining coverage.
Evaluating the effect of CAM on colony outgrowth
Fluorescent probes that stain living cells are notorious for having deleterious effects on cell viability. As such, we tested the effect of CAM, at 0.5 μM, 1 μM, and 5 μM, on outgrowth after limiting dilution. At 5 μM, a decrease in the percentage of outgrowth was observed. In comparison, the 0.5 μM, 1 μM, and label-free control show no discernible differences in the number of raw single-colony outgrowth.
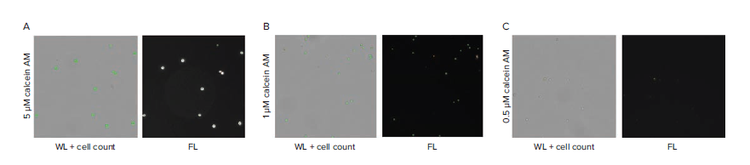
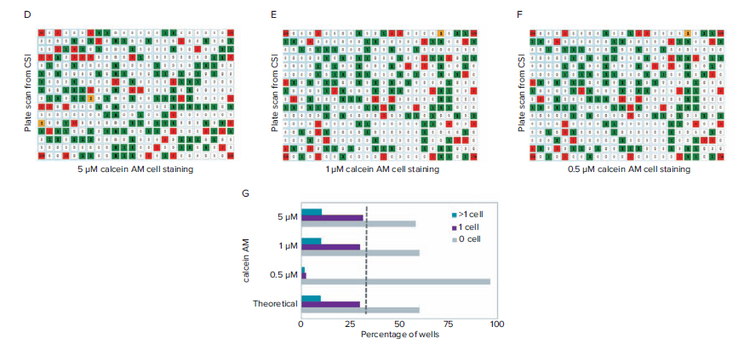
Figure 2. Finding a suitable concentration of CAM to optimize detection at the single cell level. A) High-density wells containing cells stained with 5 μm CAM shows consistent detection of cell signal. B) High-density wells containing cells stained with 1 μM CAM shows reliable detection of cell signal. C) High-density wells containing cells stained with 0.5 μM CAM shows that only a minority of cells can be detected based on the low fluorescence intensity signal. D-F) Fluorescence scan of plate using CSI from limiting dilution using 5 μM, 1 μM, and 0.5 μM CAM cell staining. G) Cell per well count tally for the 5, 1, 0.5 μM CAM cell staining and comparison of theoretical values from limiting dilution at 0.5 cells per well. Comparison of single cell counts (dashed line).
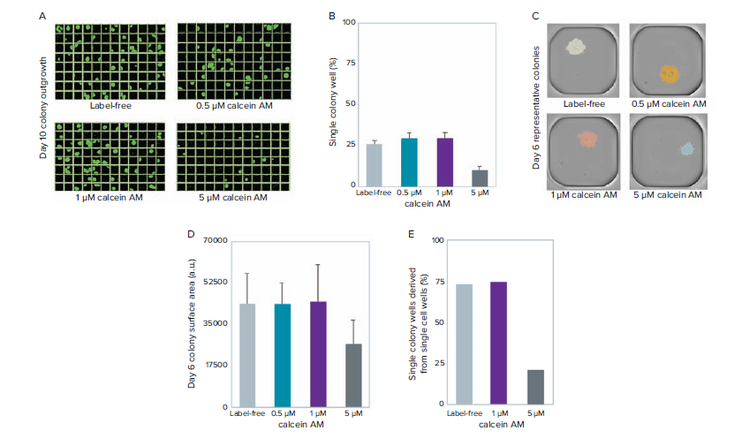
Figure 3. Measuring the effect of different CAM concentrations on viability. A) Day 10 clonal outgrowth of representative plates from label-free, 0.5 μM, 1 μM, and 5 μM CAM stained cells before limiting dilution. B) Quantification of raw outgrowth of single colony-containing wells. C) Representative single colony-containing wells at day 6. D) Quantification of colony size (surface area) shows that colonies derived from 5 μM CAM cell staining are \~40% smaller in size compared with label-free and lower CAM cell staining conditions. E) Quantification of single colony wells derived from single cells shows consistent data to raw outgrowth percentages outlined in (B).
Conclusion
- An optimized workflow is demonstrated using the calcein AM fluorescence viability dye using a fluorescence-capable CloneSelect Imager system, which shows similar viability to label-free conditions while simultaneously providing high assurance of clonality.
- 1 μM of calcein-AM was ideal for single cell detection on the CloneSelect Imager while not inducing any cytotoxicity. A similar assay optimization step would be needed for other dyes, cell types, imaging systems, and other experimental conditions.
- The fluorescence approach for confirming monoclonality is significantly beneficial in reducing the time required to manually identify single cells. The analysis can be immediately performed on day 0, providing information on clonality earlier in the workflow.